Work With Crop Map
Find location
To get started with EOSDA Crop Monitoring, you need to find the Location first. Please choose one of the options:
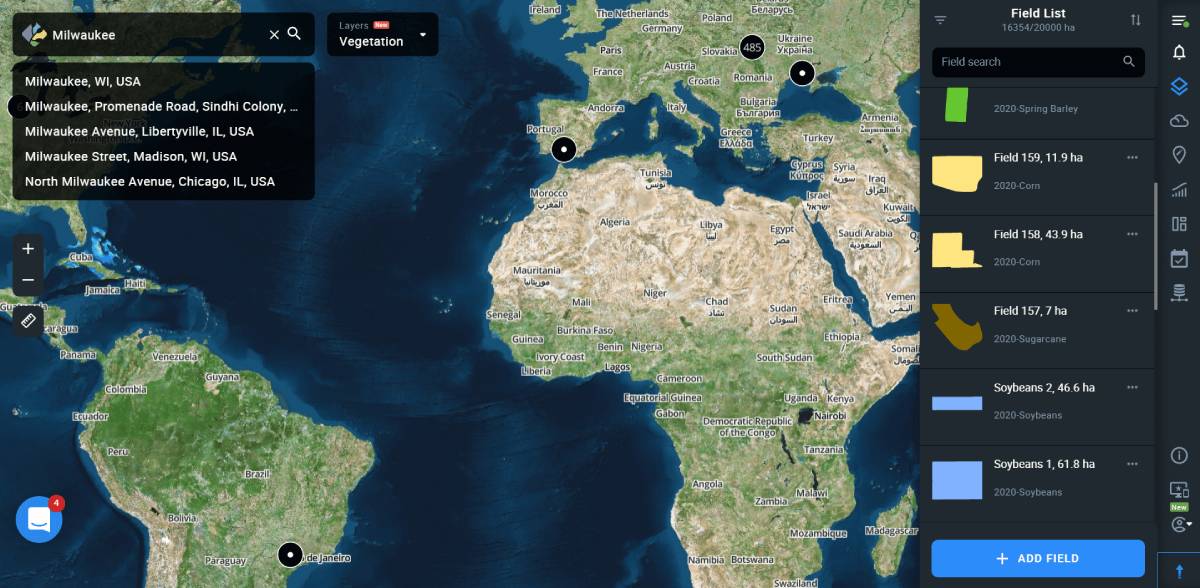
1. Use Search box
Enter the geographical name of an object into the Search box.
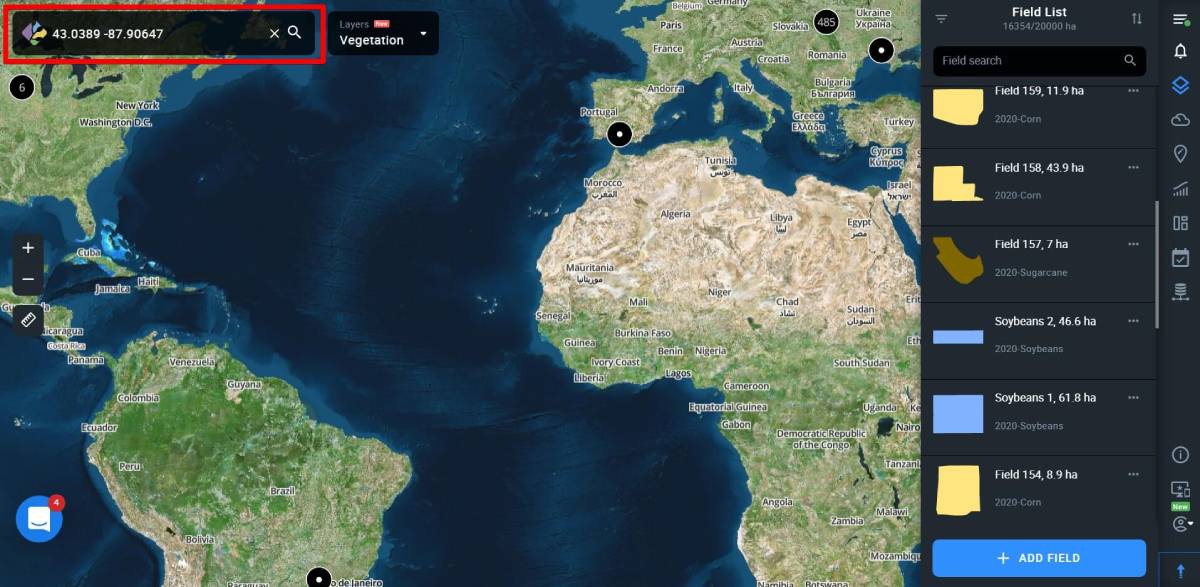
2. Use coordinates
Enter the coordinates of an object into the Search box, longitude first, latitude last.
Note: For longitudes south of the equator, put a “-” (minus) before the number. Likewise, for latitudes west of the Greenwich Meridian, put a “-” (minus) before the number.
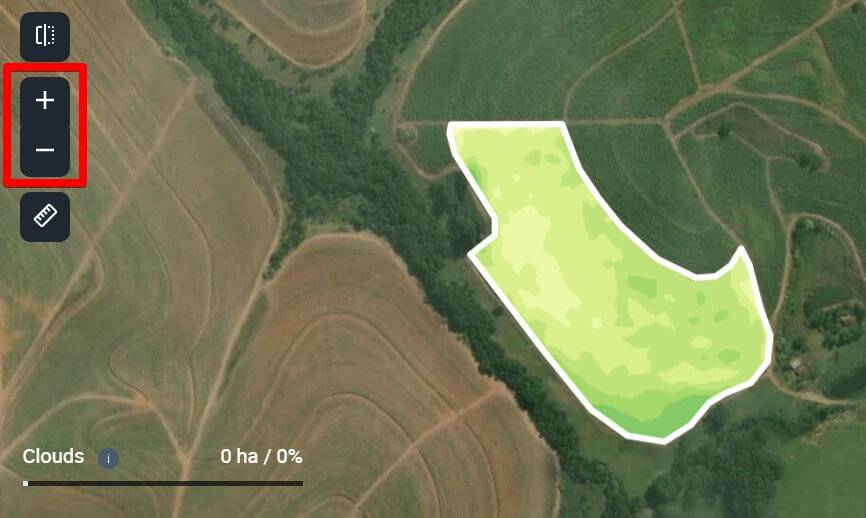
Zoom tool
Zoom in (“+”) and out (“-”) is for easier navigation (same functionality is allowed by using a mouse wheel).
Distance and area measurements
The measure distance tool (left sidebar) is designed to calculate the total area of a field or measure distance between objects. Outline your field or measure the distance to get the result displayed at the bottom of the screen.

Split view
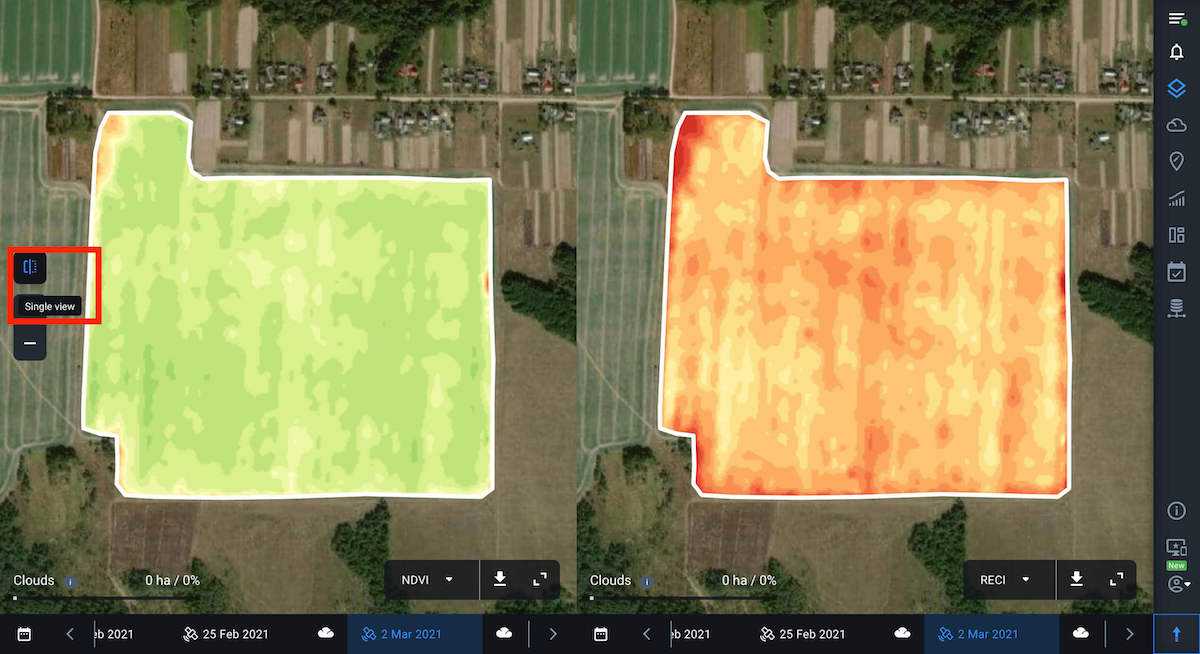
The Split view feature allows you to compare vegetation indices for the selected field for different dates. This provides an opportunity to track the change dynamics of the state of crops on the field over time, based on the values of 5 different vegetation indices to detect problems and plan field activities effectively.
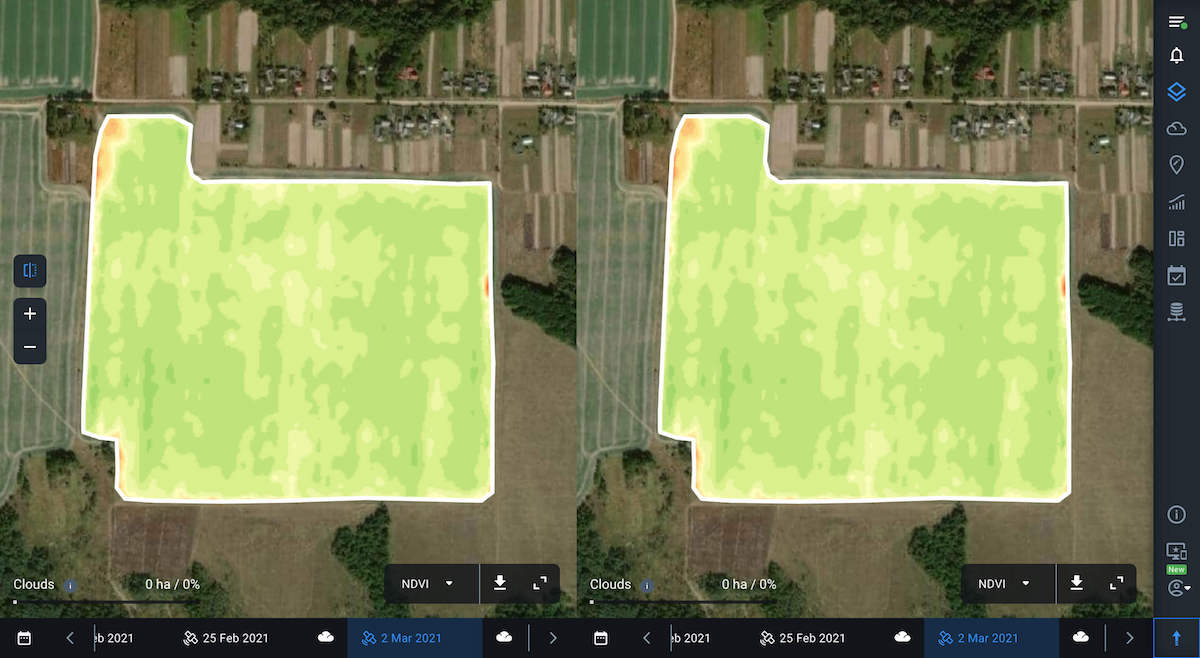
To get started, select the field you want to analyze from your Fields list and click on the Split view icon on the left side menu.
![]()
Your screen will be split into two equal parts.
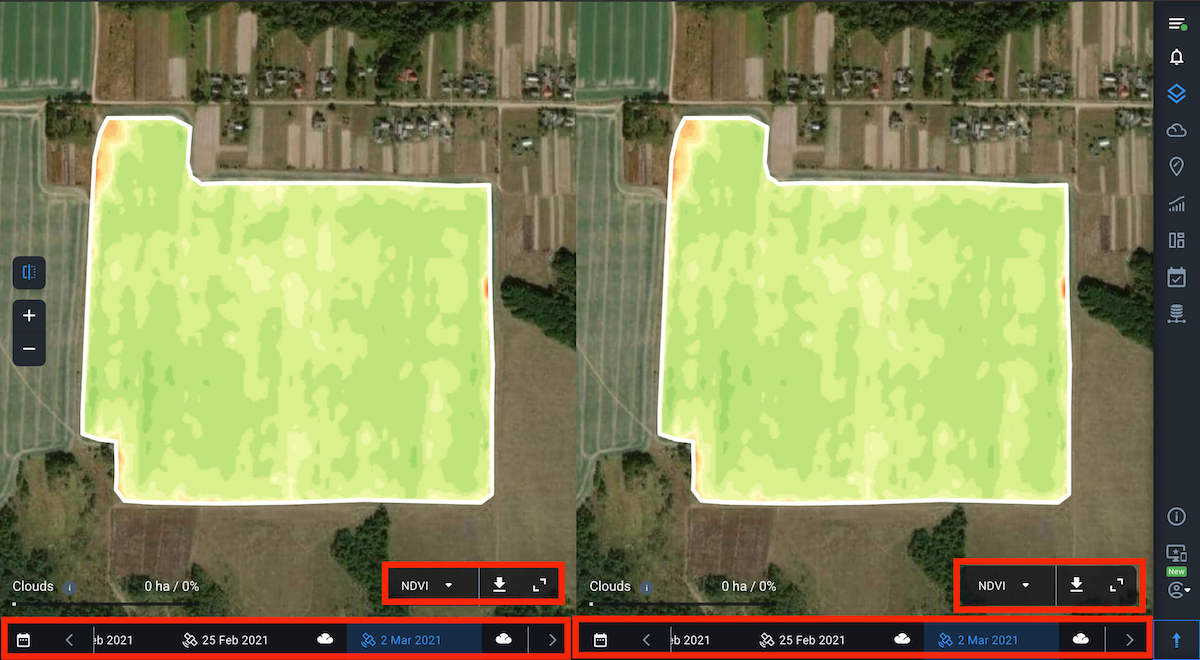
Now you can select indices and dates to compare the data. To do this, use individual timelines and the index switching panel.
If necessary, you can expand the legend to check the values for the selected index, just like in the single view mode.
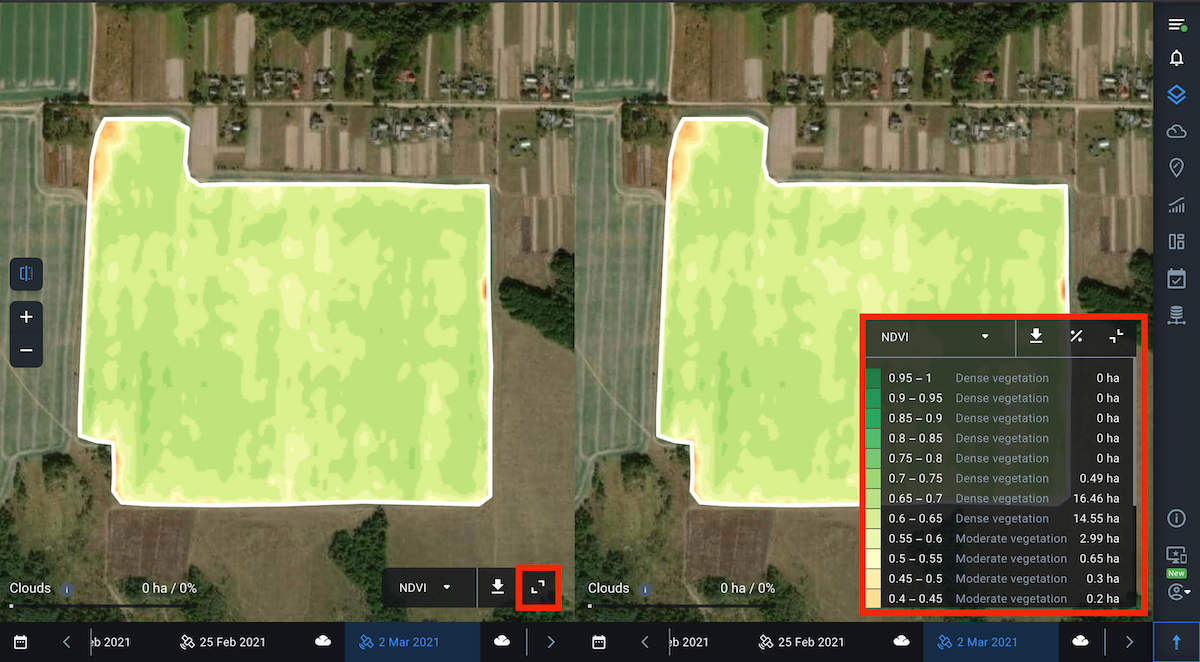
Note: By default, the NDVI values for the date of the last available image will be displayed for the selected field.
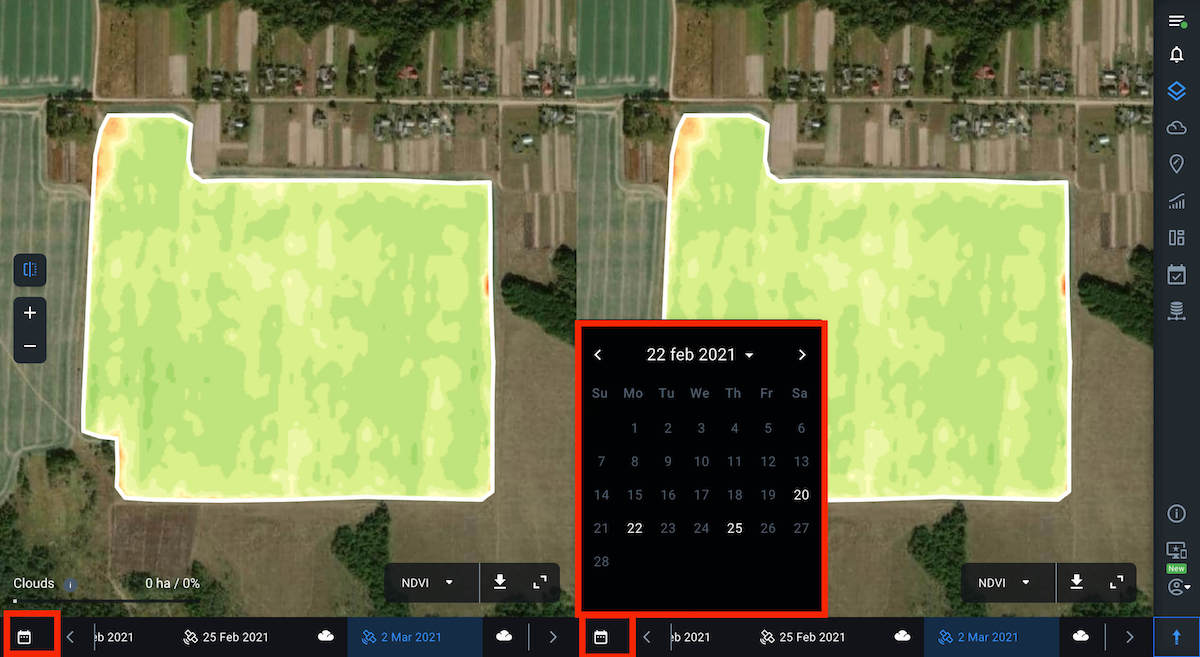
To select the necessary image date, you can also use the calendar, where the dates of available images are highlighted in white.
When you hover the cursor over any point within the field, the values of the selected indices for this point will be displayed on the map synchronously on both screens. This allows you to compare the index values for the same point within the field but for different dates.
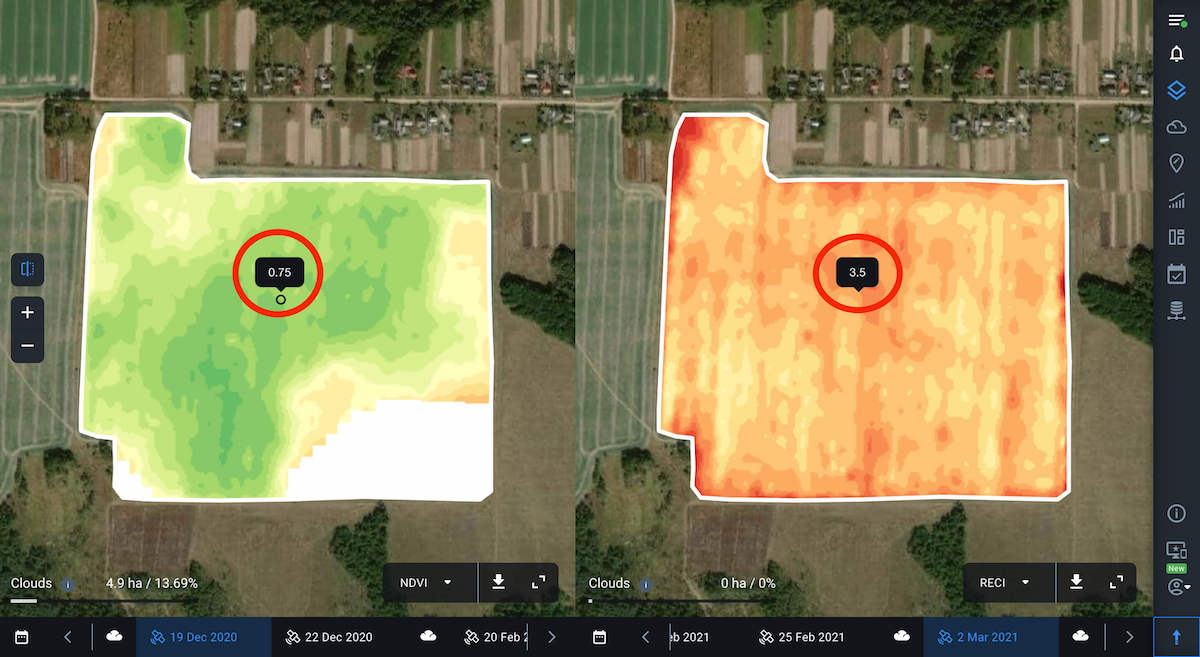
For example, to see how the vegetation has been developing on your field, select NDVI for both viewers and switch between dates in the timeline. This way you can identify areas of the field with the most or least uniform vegetation and identify areas that require your attention the most.
Note: The historical data on vegetation index values goes back 5 years.
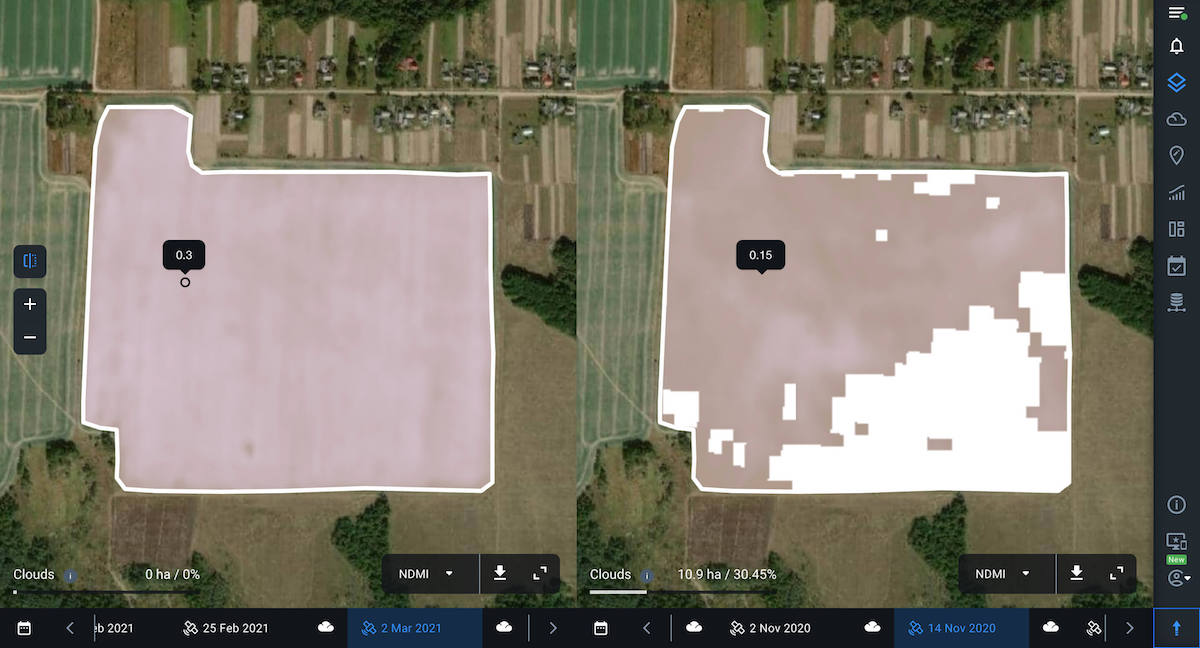
In the same way, you can track how the state of the vegetation on the field has been changing, based on the values of other available indices, including NDMI moisture index. With the help of this index, you can identify the threat of water stress and effectively plan out irrigation.
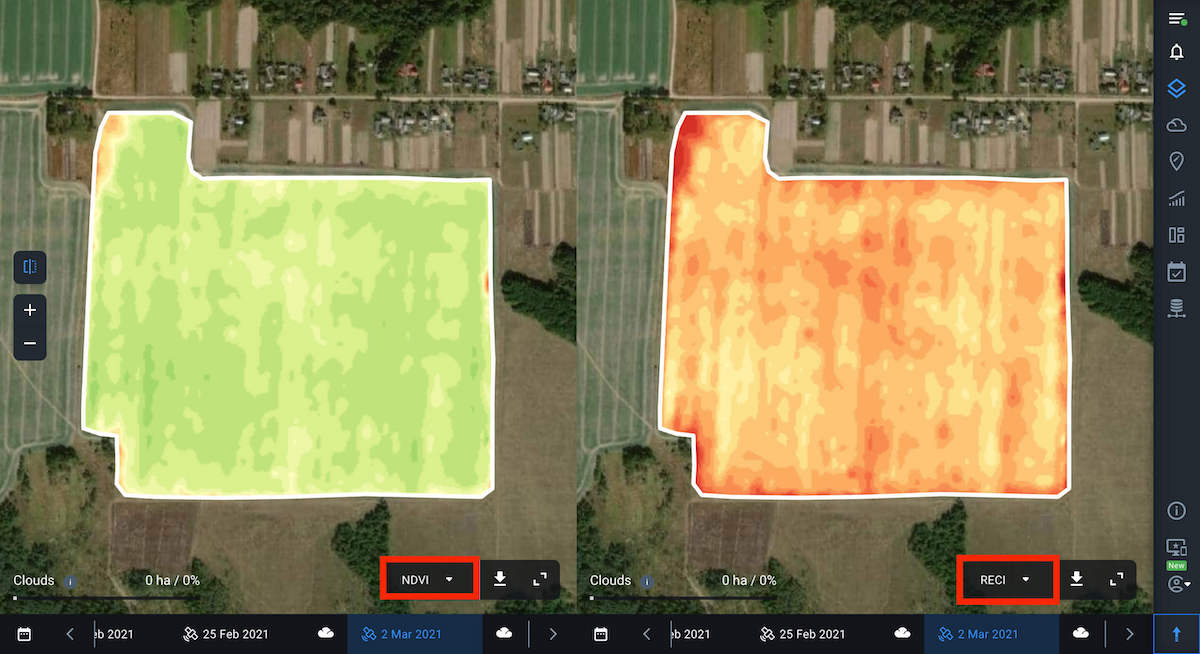
You can also select and compare different indices in each viewer. It’s helpful for more complex field analysis since to see a complete picture of your crop’s health, one index may not be enough. For example, at the early stages of crop development, the presence of bare soil can affect the accuracy of NDVI. Therefore, it makes sense to compare NDVI with other vegetation indices for the same field and date.
By comparing different vegetation indices, you can visualize and analyze the current state of crops, given the crop type and the growth stage.
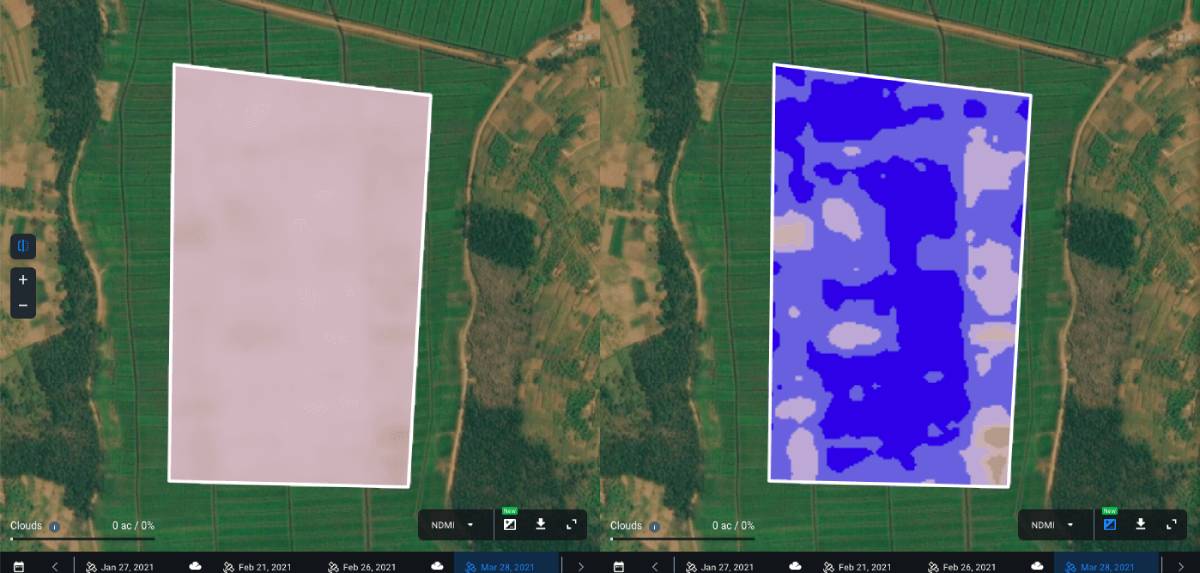
For example, here you see two different vegetation indices for the same field and for the same date.
You can also download data by clicking on the download button next to the index name.
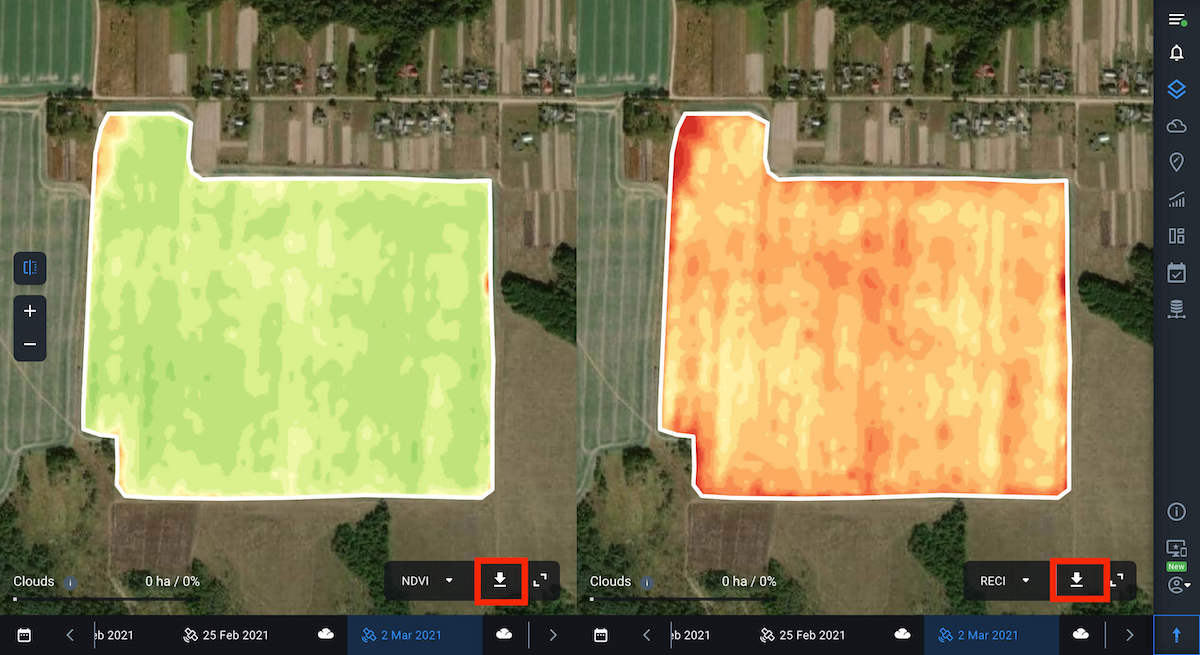
To return to single view mode, click on the corresponding icon on the left side menu.
Layers – an integrated analysis of crop health on one screen
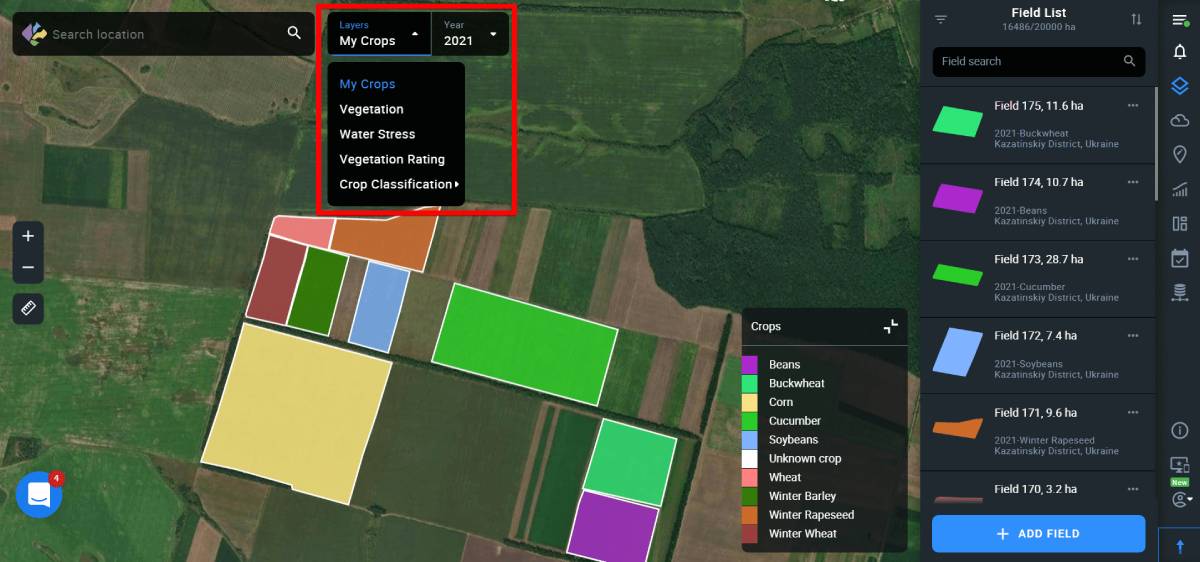
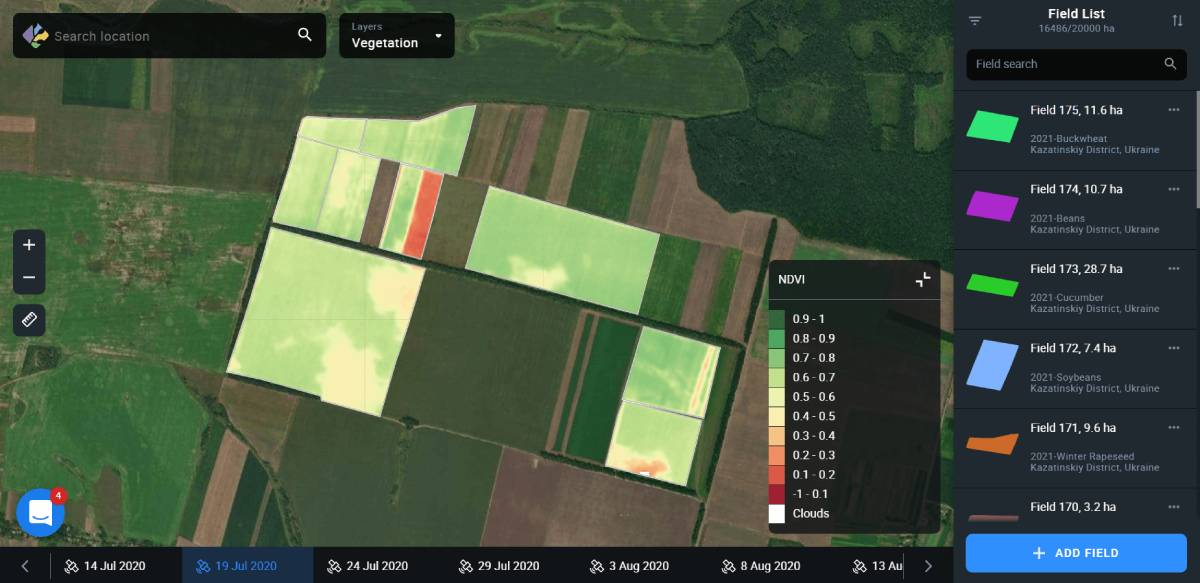
The Layers feature allows you to visualize and analyze the state of crops in all of your fields at the same time. To do that, you simply need to switch between 5 parameters or Layers – My Crops, Vegetation, Water Stress, Vegetation Rating, and Crop Classification in a convenient drop-down menu.
The system only selects images with less than 90% cloudiness depicting all of your fields. Cloudy locations will be marked with the corresponding mask. To see your fields, you need to zoom in and go from the pins to the fields’ outlines.
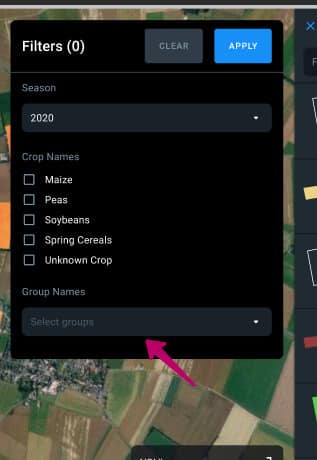
You can also sort the data by crop and year using the filter in the right side menu. This will give you the opportunity to analyze the history of the development of a particular crop in all of your fields at once over 5 years in terms of the selected layer. The obtained data will help you identify problem fields and make reliable decisions, as well as effectively plan crop rotation and field activities.
My Crops layer
The first layer on the Layers list is My Crops. When this layer is selected, the fields are displayed on the map classified by crops. This enables you to see an overall picture of crops distribution among your fields. Each crop is given a corresponding color, which is displayed in the legend in the lower right corner of the screen. By default, the map displays the most recently planted crops for all of the fields.
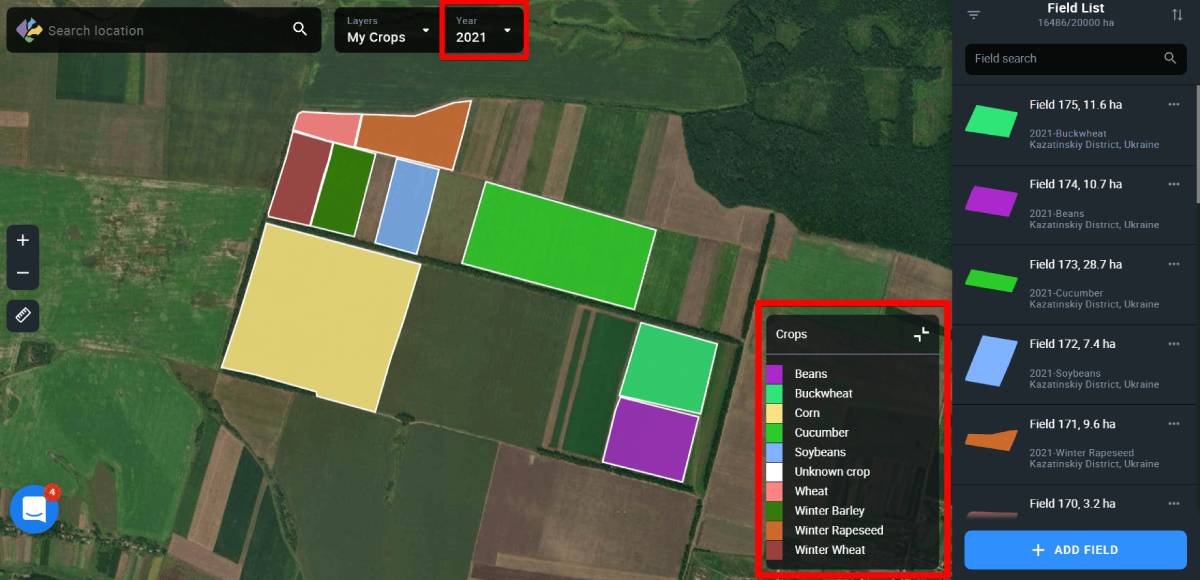
You can select the crop and the year by using a special filter.
Thanks to the visualization of crop rotation for the last 5 years on the screen, you can make better-informed planting decisions.
Vegetation layer
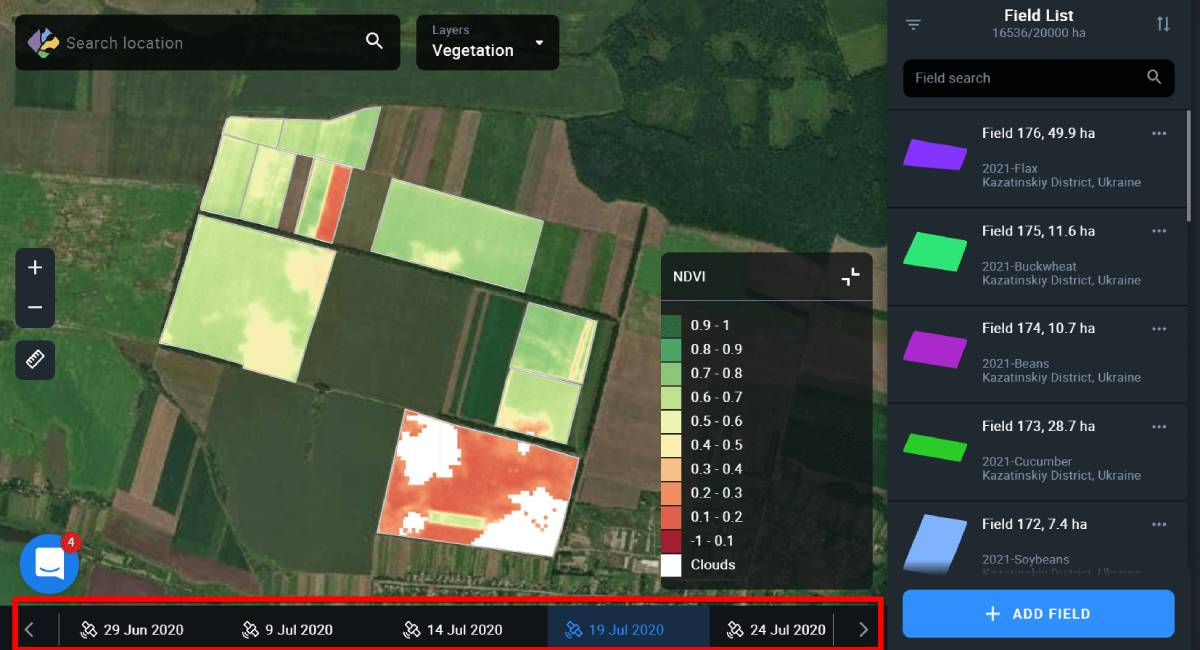
This layer shows the vegetation level in all of your fields at the same time, based on the NDVI vegetation index values. For each field, the system displays the average index value and highlights it with a specific color. Each color corresponds to one of the 10 specific ranges of values displayed in the legend in the lower right corner of the screen. Seeing these NDVI ranges on the screen allows you to comprehensively analyze the state of vegetation in all your fields at the same time, identify problem fields or a group of fields, and, overall, effectively plan actions for further monitoring.
If you want to analyze a specific field or group of fields, click “Select group” using the filter in the right side menu.
When you select a field on the map, you automatically switch to the monitoring view of this field according to the NDVI index values for the date you have selected.
Note: You can also create a new field group based on the vegetation data for different fields.
Vegetation data by default is displayed based on the last available field image.
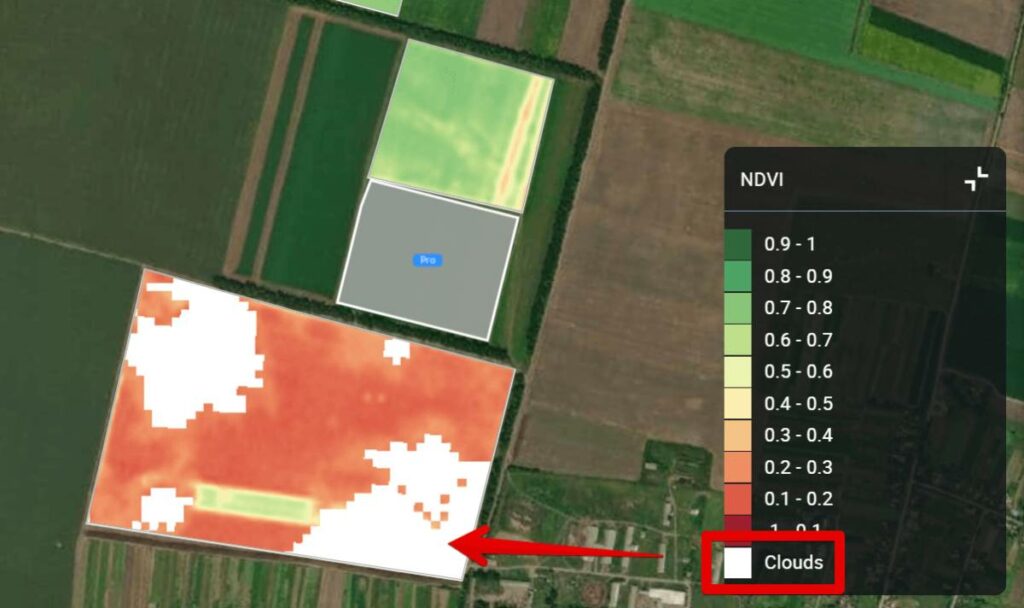
Note: Available images are the images that have all of your fields at once. Cloudy locations will be marked with a corresponding mask.
To view any previous image, select the date in the timeline at the bottom of the screen.
Note: Pictures taken over a year ago are available to Pro users only.
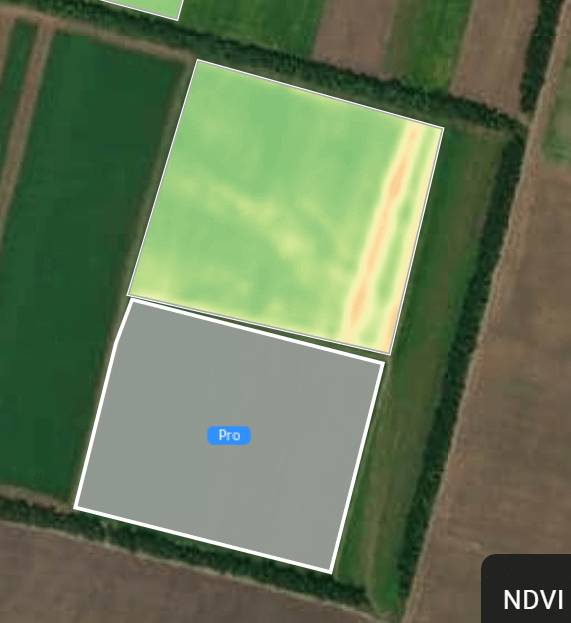
Note: If a field or group of fields has exceeded the field acreage limit of your subscription plan, these fields will be marked with a Pro icon.
While in the Vegetation layer, you can also use a special filter to select the crop and the year. This will allow you to analyze the fields both in terms of a specific crop and vegetation at the same time. This data will help you discover the relationship between the vegetation in the field and the crop it is planted with. This will enable you to make reliable decisions about field activities.
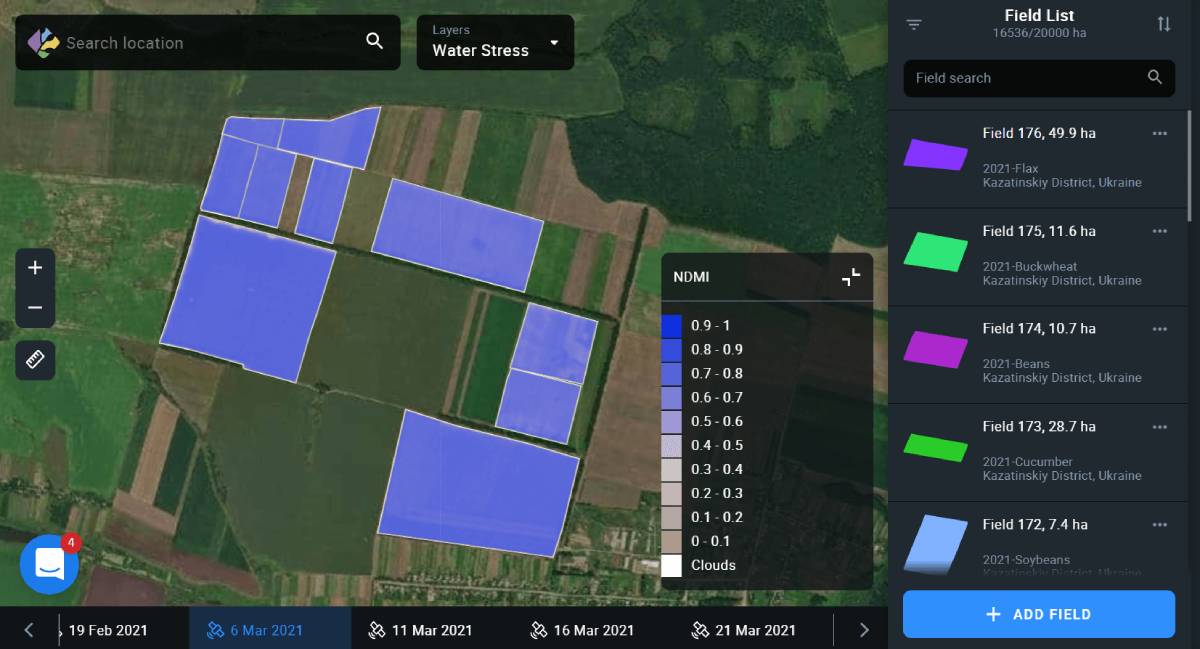
Water Stress layer
The Water Stress layer displays the moisture level in plants in all of your fields based on the NDMI values. For each field, the system displays the average value of the index and highlights it with a specific color. Each color corresponds to one of the 10 specific ranges of values displayed in the legend in the lower right corner of the screen. This makes it possible to analyze the moisture level for all of your fields at the same time, identify problem areas – lack or excess of moisture – and effectively plan irrigation in the future.
Use the filter on the right side menu to view moisture levels for a specific field, crop, and year.
When you select a field on the map, you automatically switch to the monitoring view of this field according to the NDMI index values for the date you have selected.
Moisture level data is displayed by default based on the last available field image.
Note: Available images are the images that have all of your fields at once. Cloudy locations will be marked with a corresponding mask.
Note: The Water Stress layer is available to Pro users only.
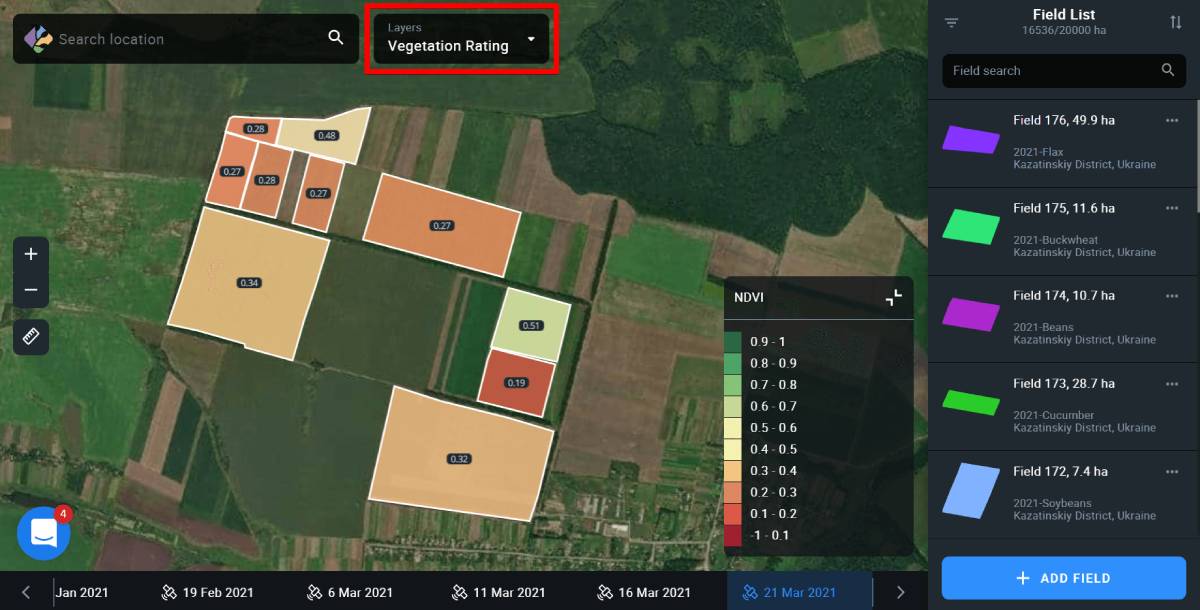
Vegetation Rating layer
The Fields Rating layer is analogous to Field Leaderboard. This layer displays all of your fields according to the average value of the NDVI index. This allows you to visualize the productivity data from all of your fields on one screen.
The data for average NDVI values is displayed by default based on the most recent field image available.
Note: Available images are the images that have all of your fields at once. Cloudy locations will be marked with a corresponding mask.
You can also select field, crop and year by selecting the necessary options from the right side menu.
Note: The Vegetation Rating layer is available to Pro users only.
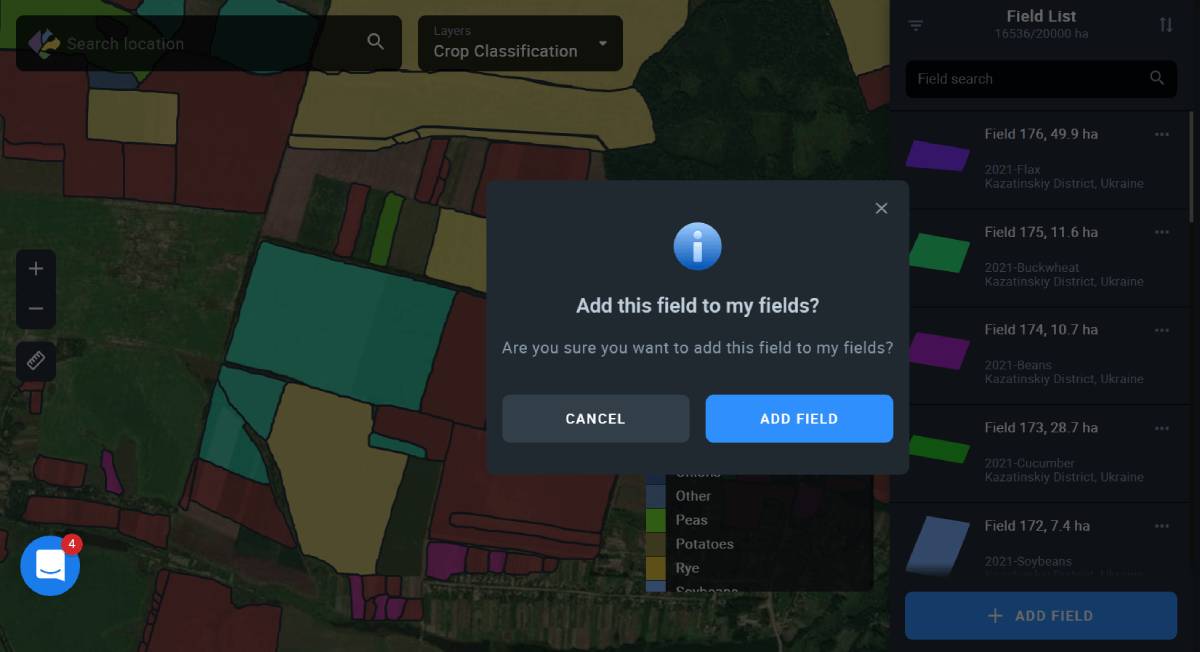
Crop Classification layer
The Crop Classification layer is only available in Ukraine and displays the location of all the crops for the whole country, according to the classification map created by EOSDA. The list of available crops is displayed in the lower right corner of the screen, instead of the vegetation index legend.

Note: In the Crop Classification layer, you can filter out the fields only by season.
You can also add any field that appears on the map in this layer to your Field List. To do so, select the necessary field on the map and click on it.
Click Add Field to add the field to the system.
Note: Crop Classification layer is available to Pro users only.
Contrast view
Switch between Standard and Contrast views of the field on the map by clicking on the corresponding icon in the lower right corner of the map.
When the Contrast view is activated, the icon appears blue.
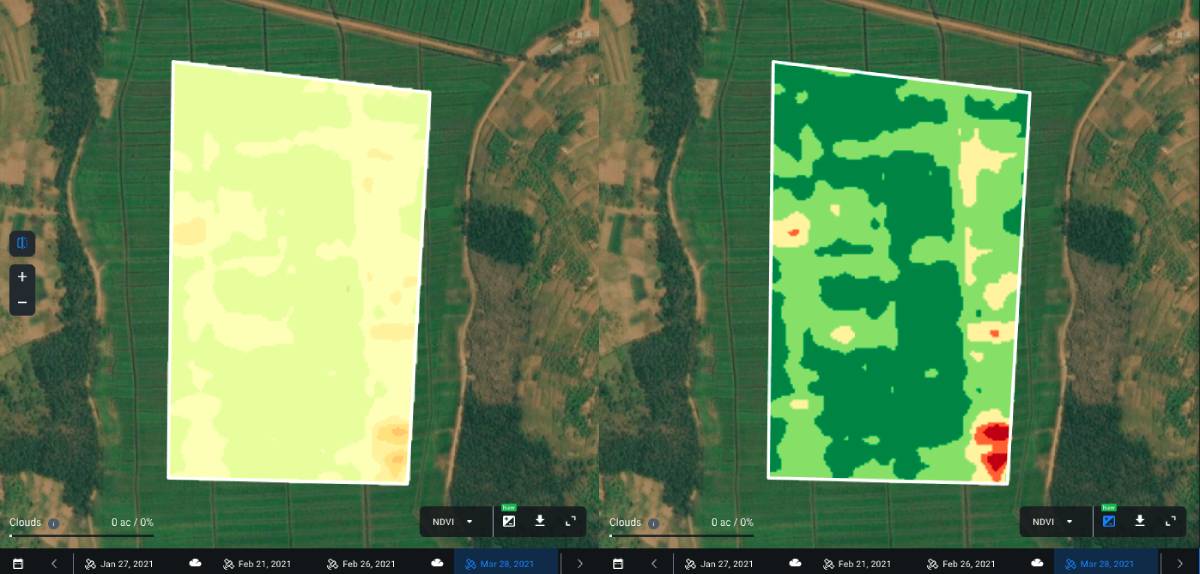
Standard VS Contrast view: What’s the difference?
Standard view is best applied when the values of a given index vary greatly across the field, covering almost a full standard value range. For NDVI*, it is -1 to 1. On the map, you will see smooth transitions of different shades of red, yellow, and green**, without much contrast, if any at all.
*Standard range can vary depending on the index.
**NDMI is represented by different shades of blue.
Contrast view, on the other hand, solves the issue of visualizing low variability of the index values in the field when there is a need to highlight the differences.
Each shade in the palette on the map corresponds to the available index value. In Standard view, low variability of the index values will be displayed as a collection of several similar shades. To better highlight the differences, and detect the problem areas in the field, you need to enable the Contrast view. In this case, instead of a collection of shades blending with one another on the map, you will see distinctly different colors, revealing previously unnoticed issues with crops.
Contrast view is applicable to all the indices available in our product, including the NDMI moisture index.