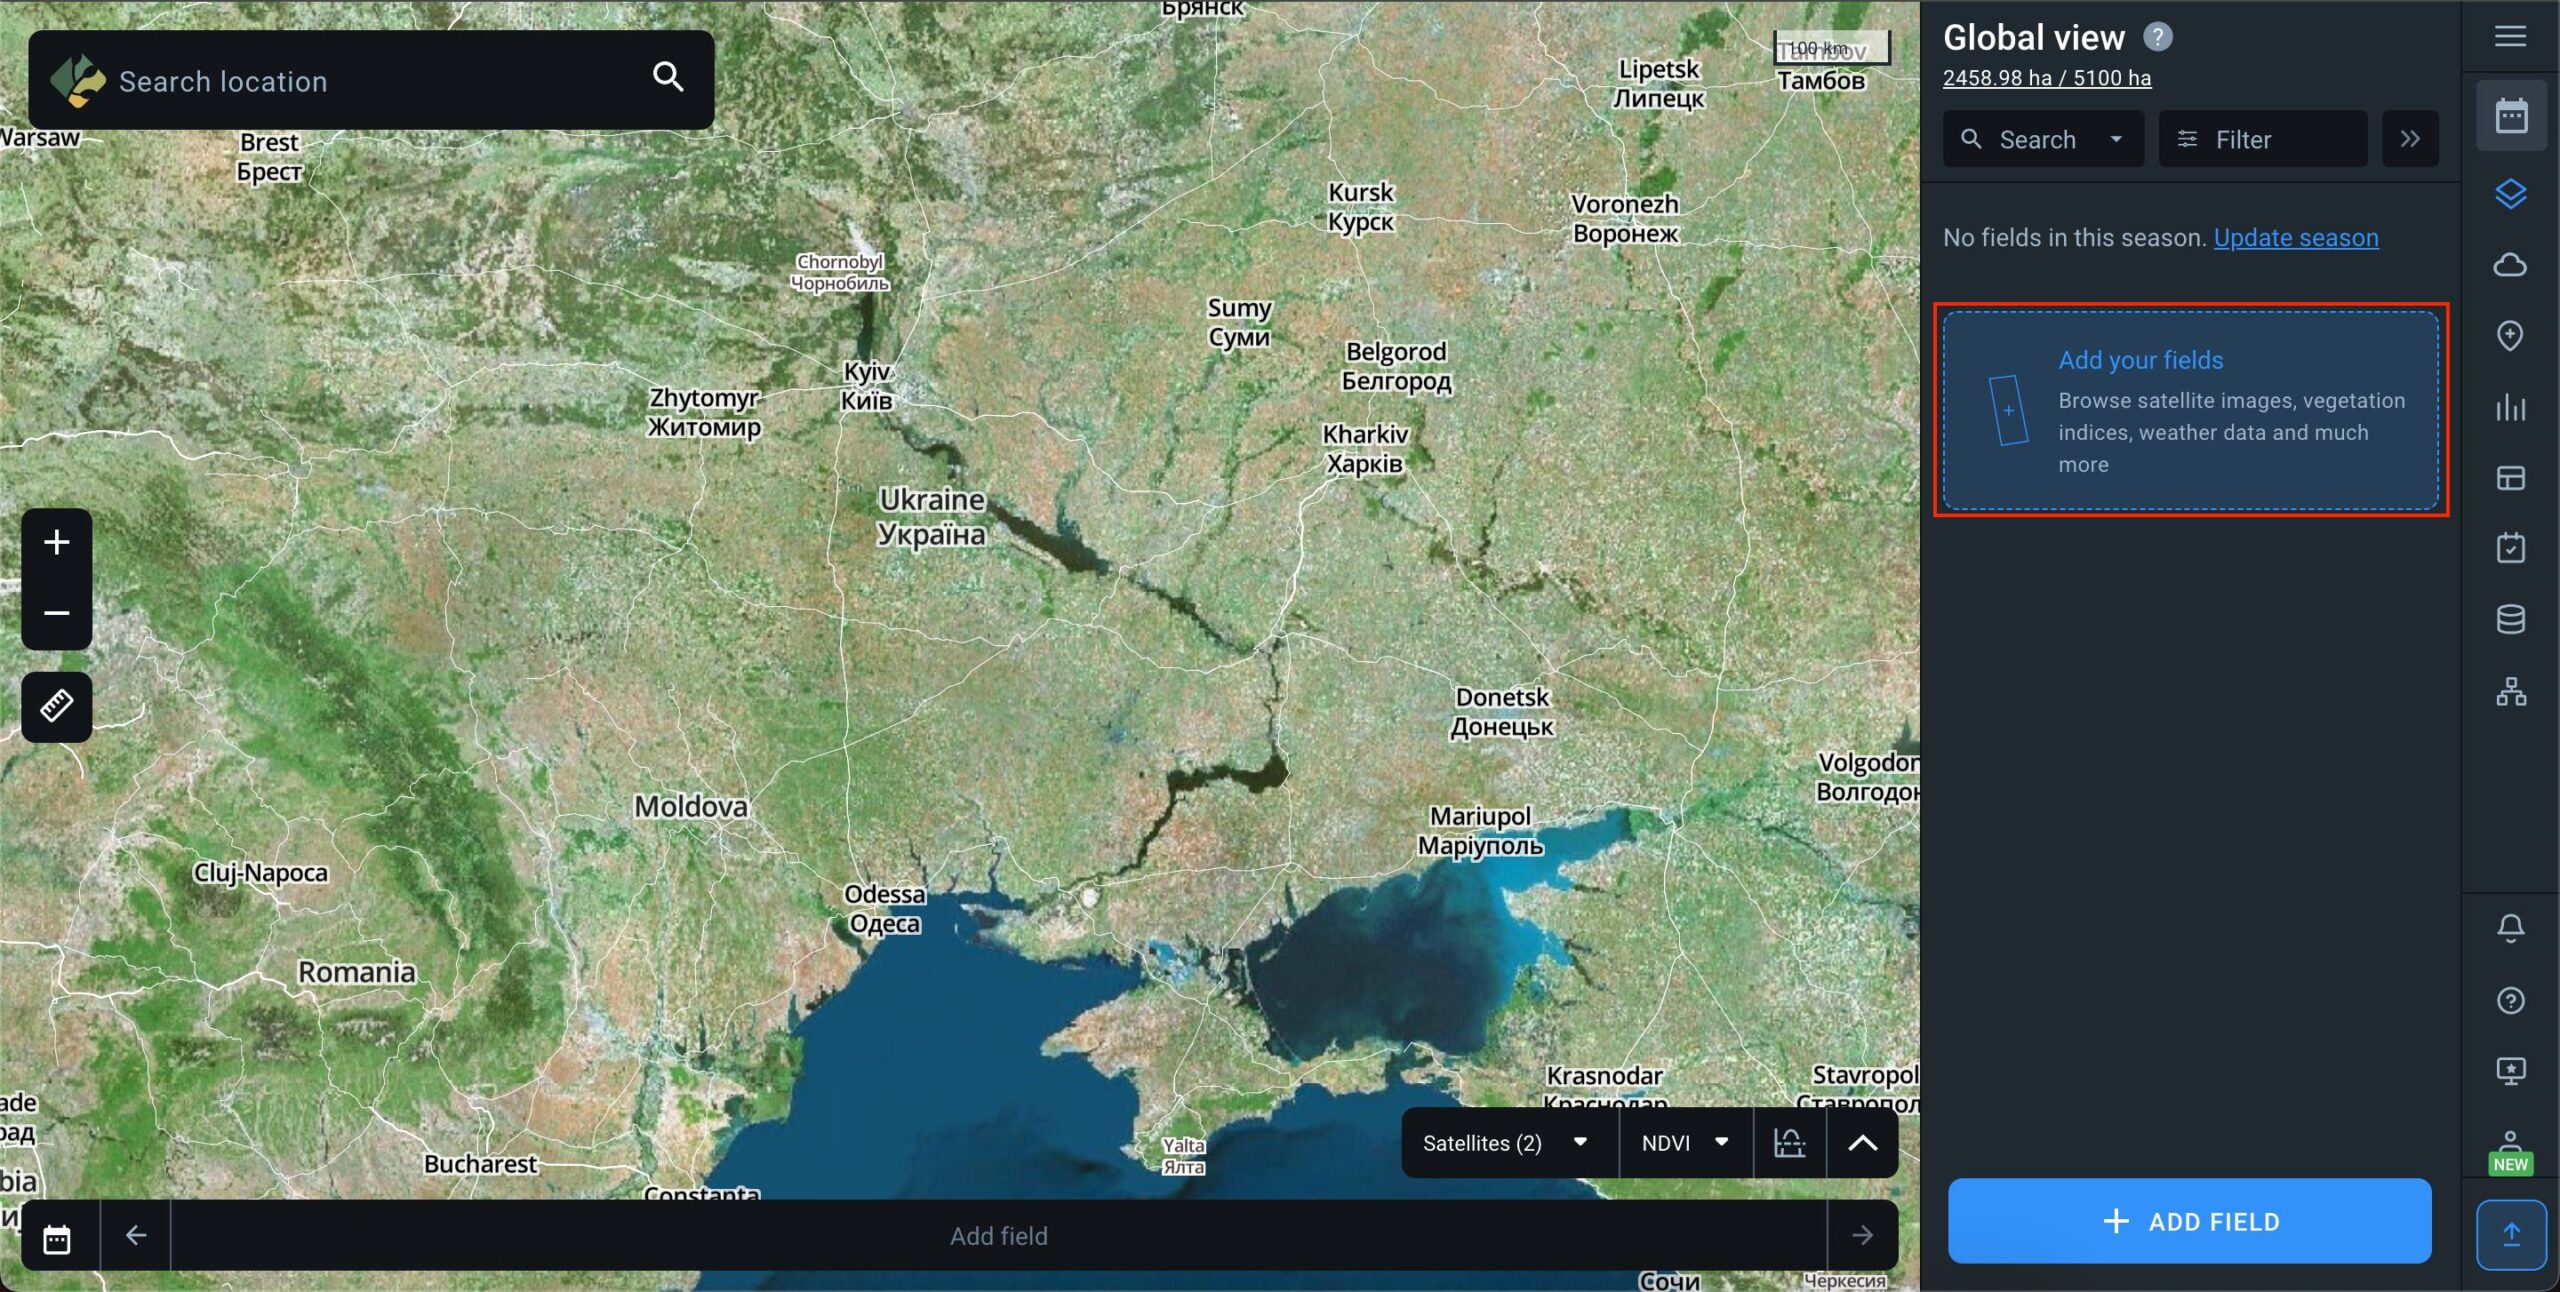
Add field
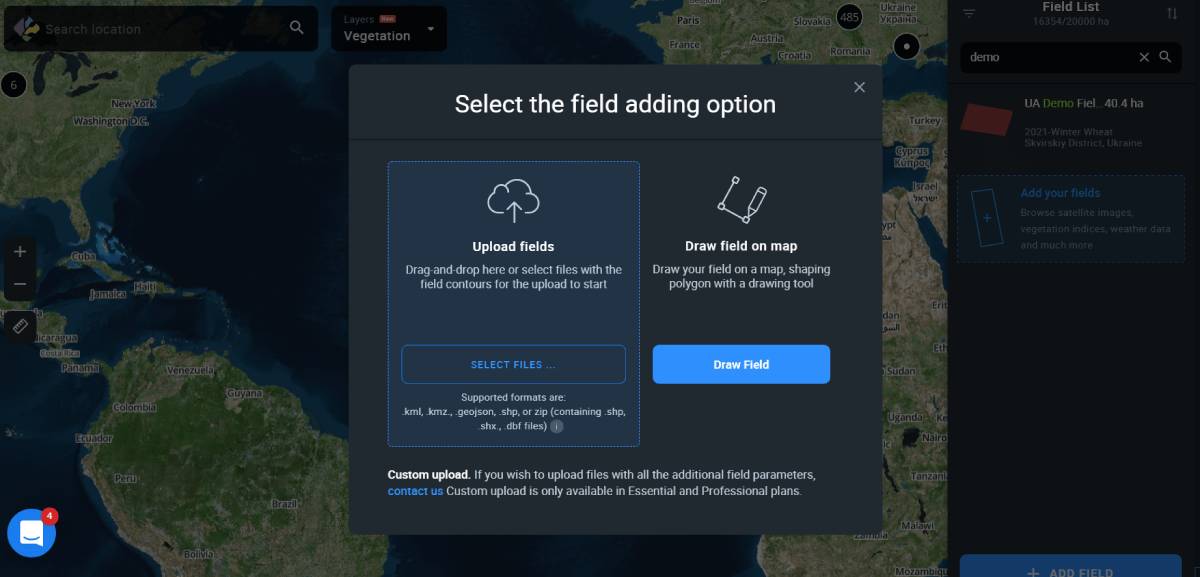
In order to access satellite images of your fields, get the weather forecast and other data, you need to add fields to your account first. There are several available options:
- Draw field on map
- Upload fields
- Custom upload (contact us)
Start by clicking +ADD FIELD located in the right bottom corner of your screen.
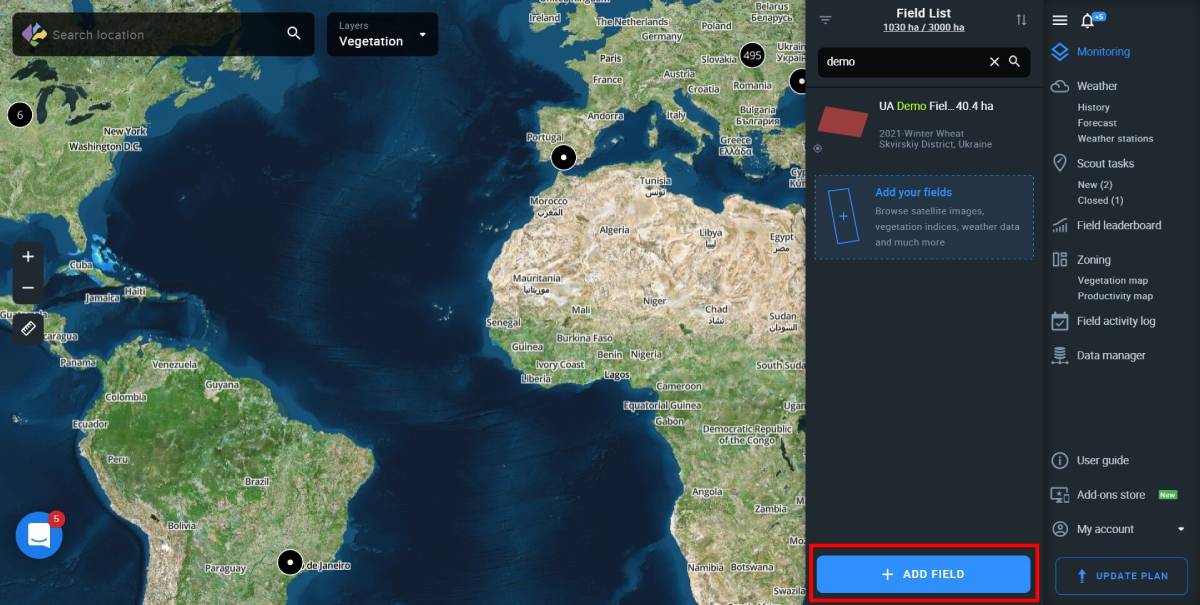
A window with available options should pop up.
Upload fields
Uploading fields without parameters
This option allows you to upload files containing pre-drawn field contours to the system. Currently, EOSDA Crop Monitoring supports 4 different format types: .shp, .kml, .kmz, .geojson.
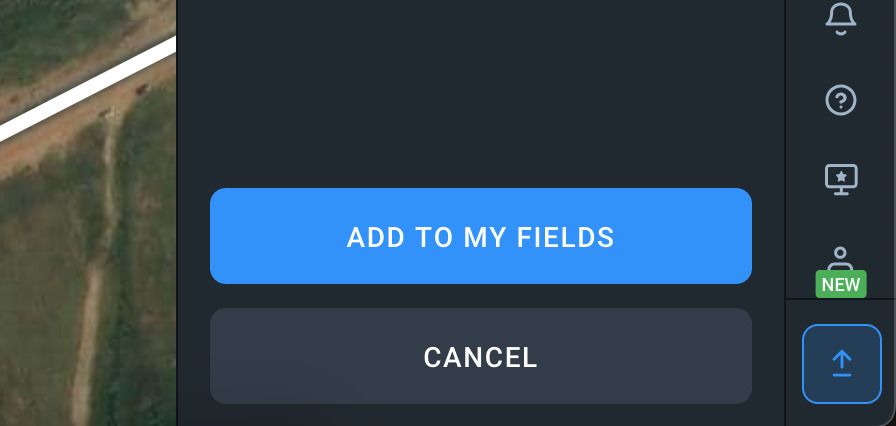
You can either drag-and-drop files onto the web page or click Add your fields.
As soon as the field contours appear on the map along with the field card data in the right sidebar menu, click ADD TO MY FIELDS to complete the operation.
Or you can click Cancel (located just below the ADD TO MY FIELDS button) to abort.
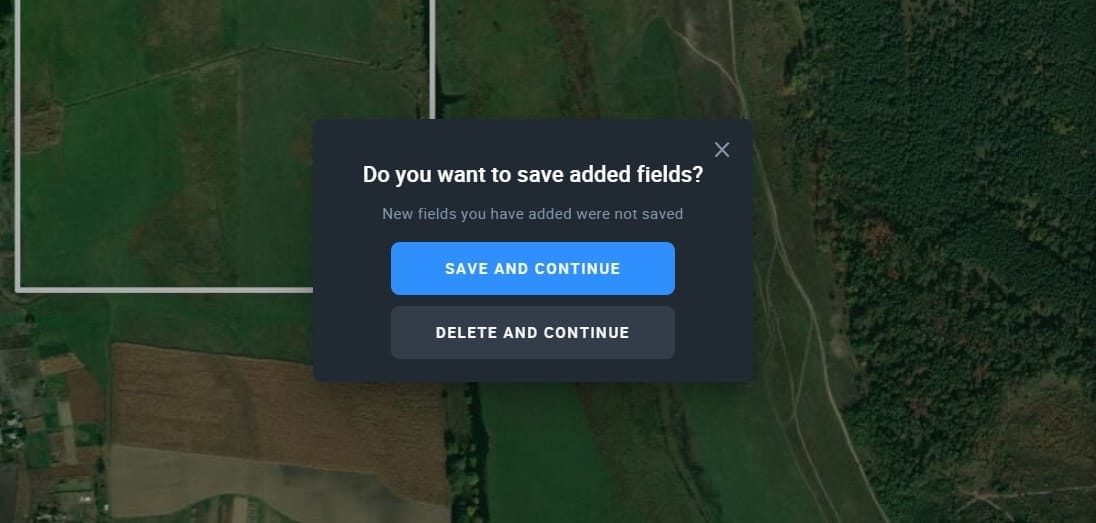
A modal window will offer you two choices:
- SAVE AND CONTINUE. Press this button to automatically add the uploaded field to the list.
- DELETE AND CONTINUE. Hit this button if you don’t want to add the uploaded field to the list.
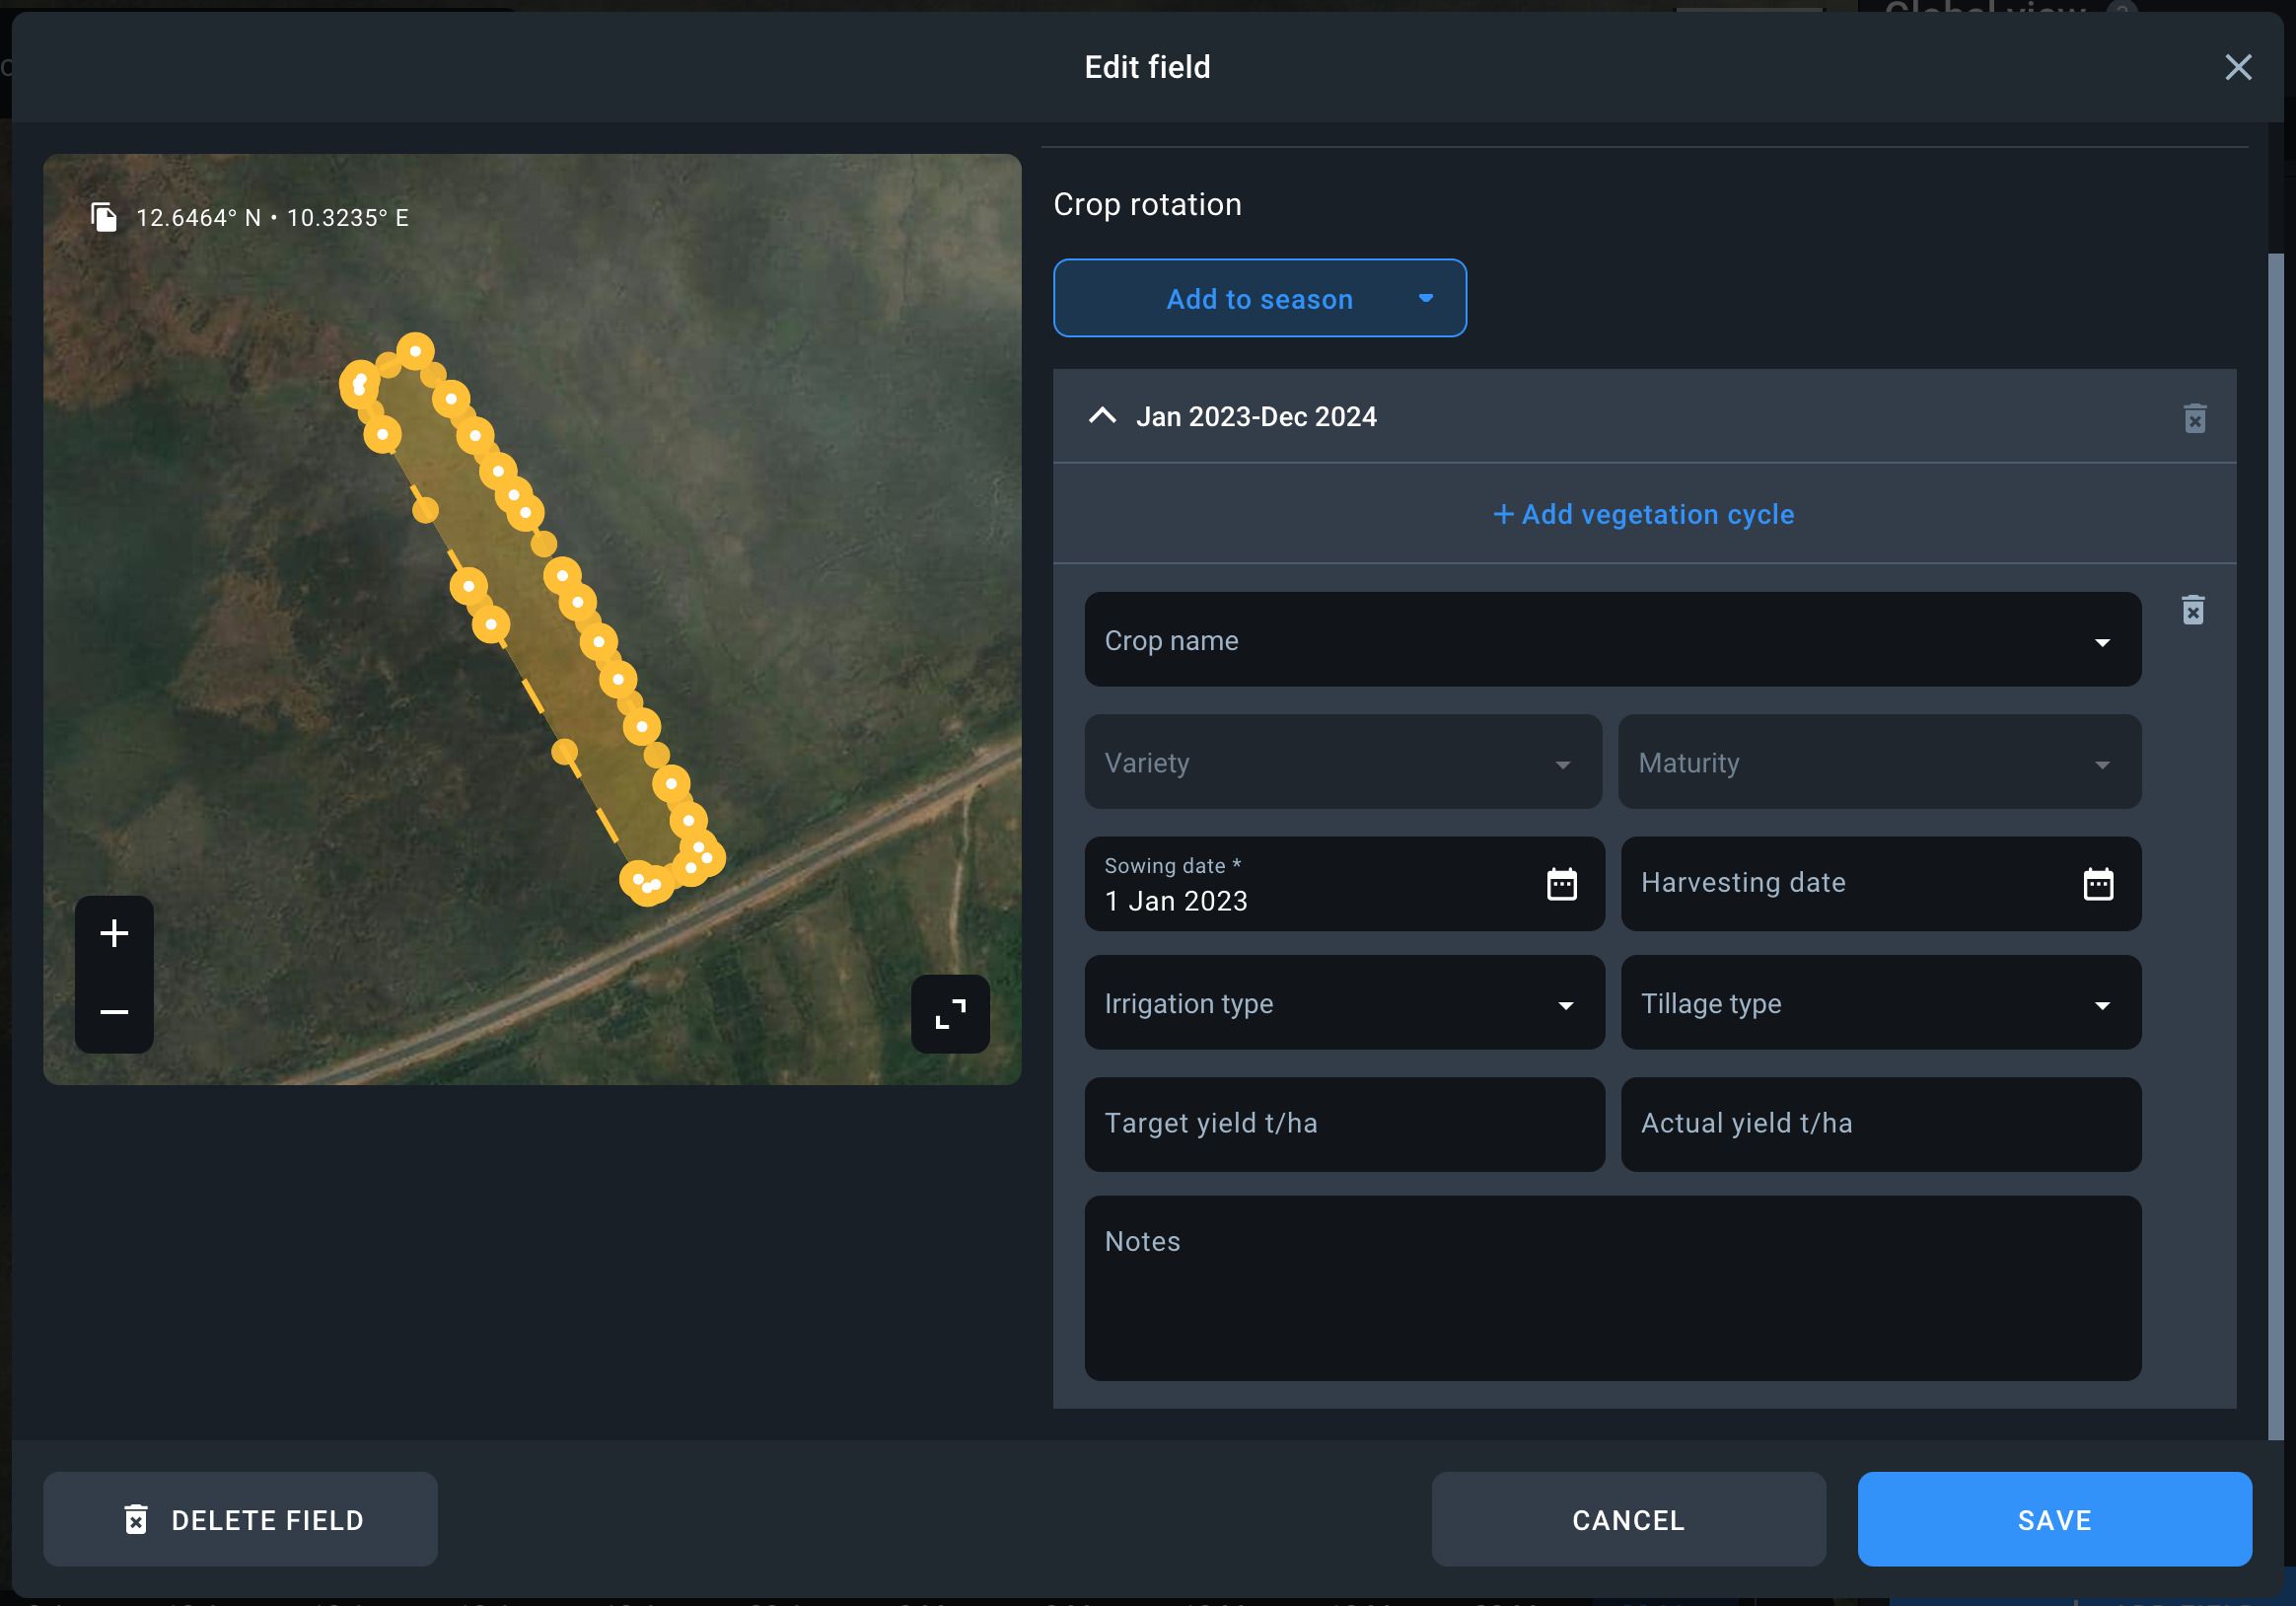
Add more information about the newly uploaded field to ensure maximum efficiency of monitoring.
- Field Name (for your convenience)
- Group Name (to better organize your fields in the list)
- Crop Rotation data* (to manage your fields by the crop name, sowing date, and season.
*Accurate monitoring of vegetation development depends on the correctness of crop rotation data.
Uploading fields with parameters
Files are uploaded through the standard process by clicking the “+ADD FIELD” button.
In case you upload .zip (.shp, .dbf, .prj, .shx), .kml, .kmz, or .geojson files that contain field parameters such as crop type, field name, group, sowing date, harvest date, notes, and season, a Fields upload manager window will open.
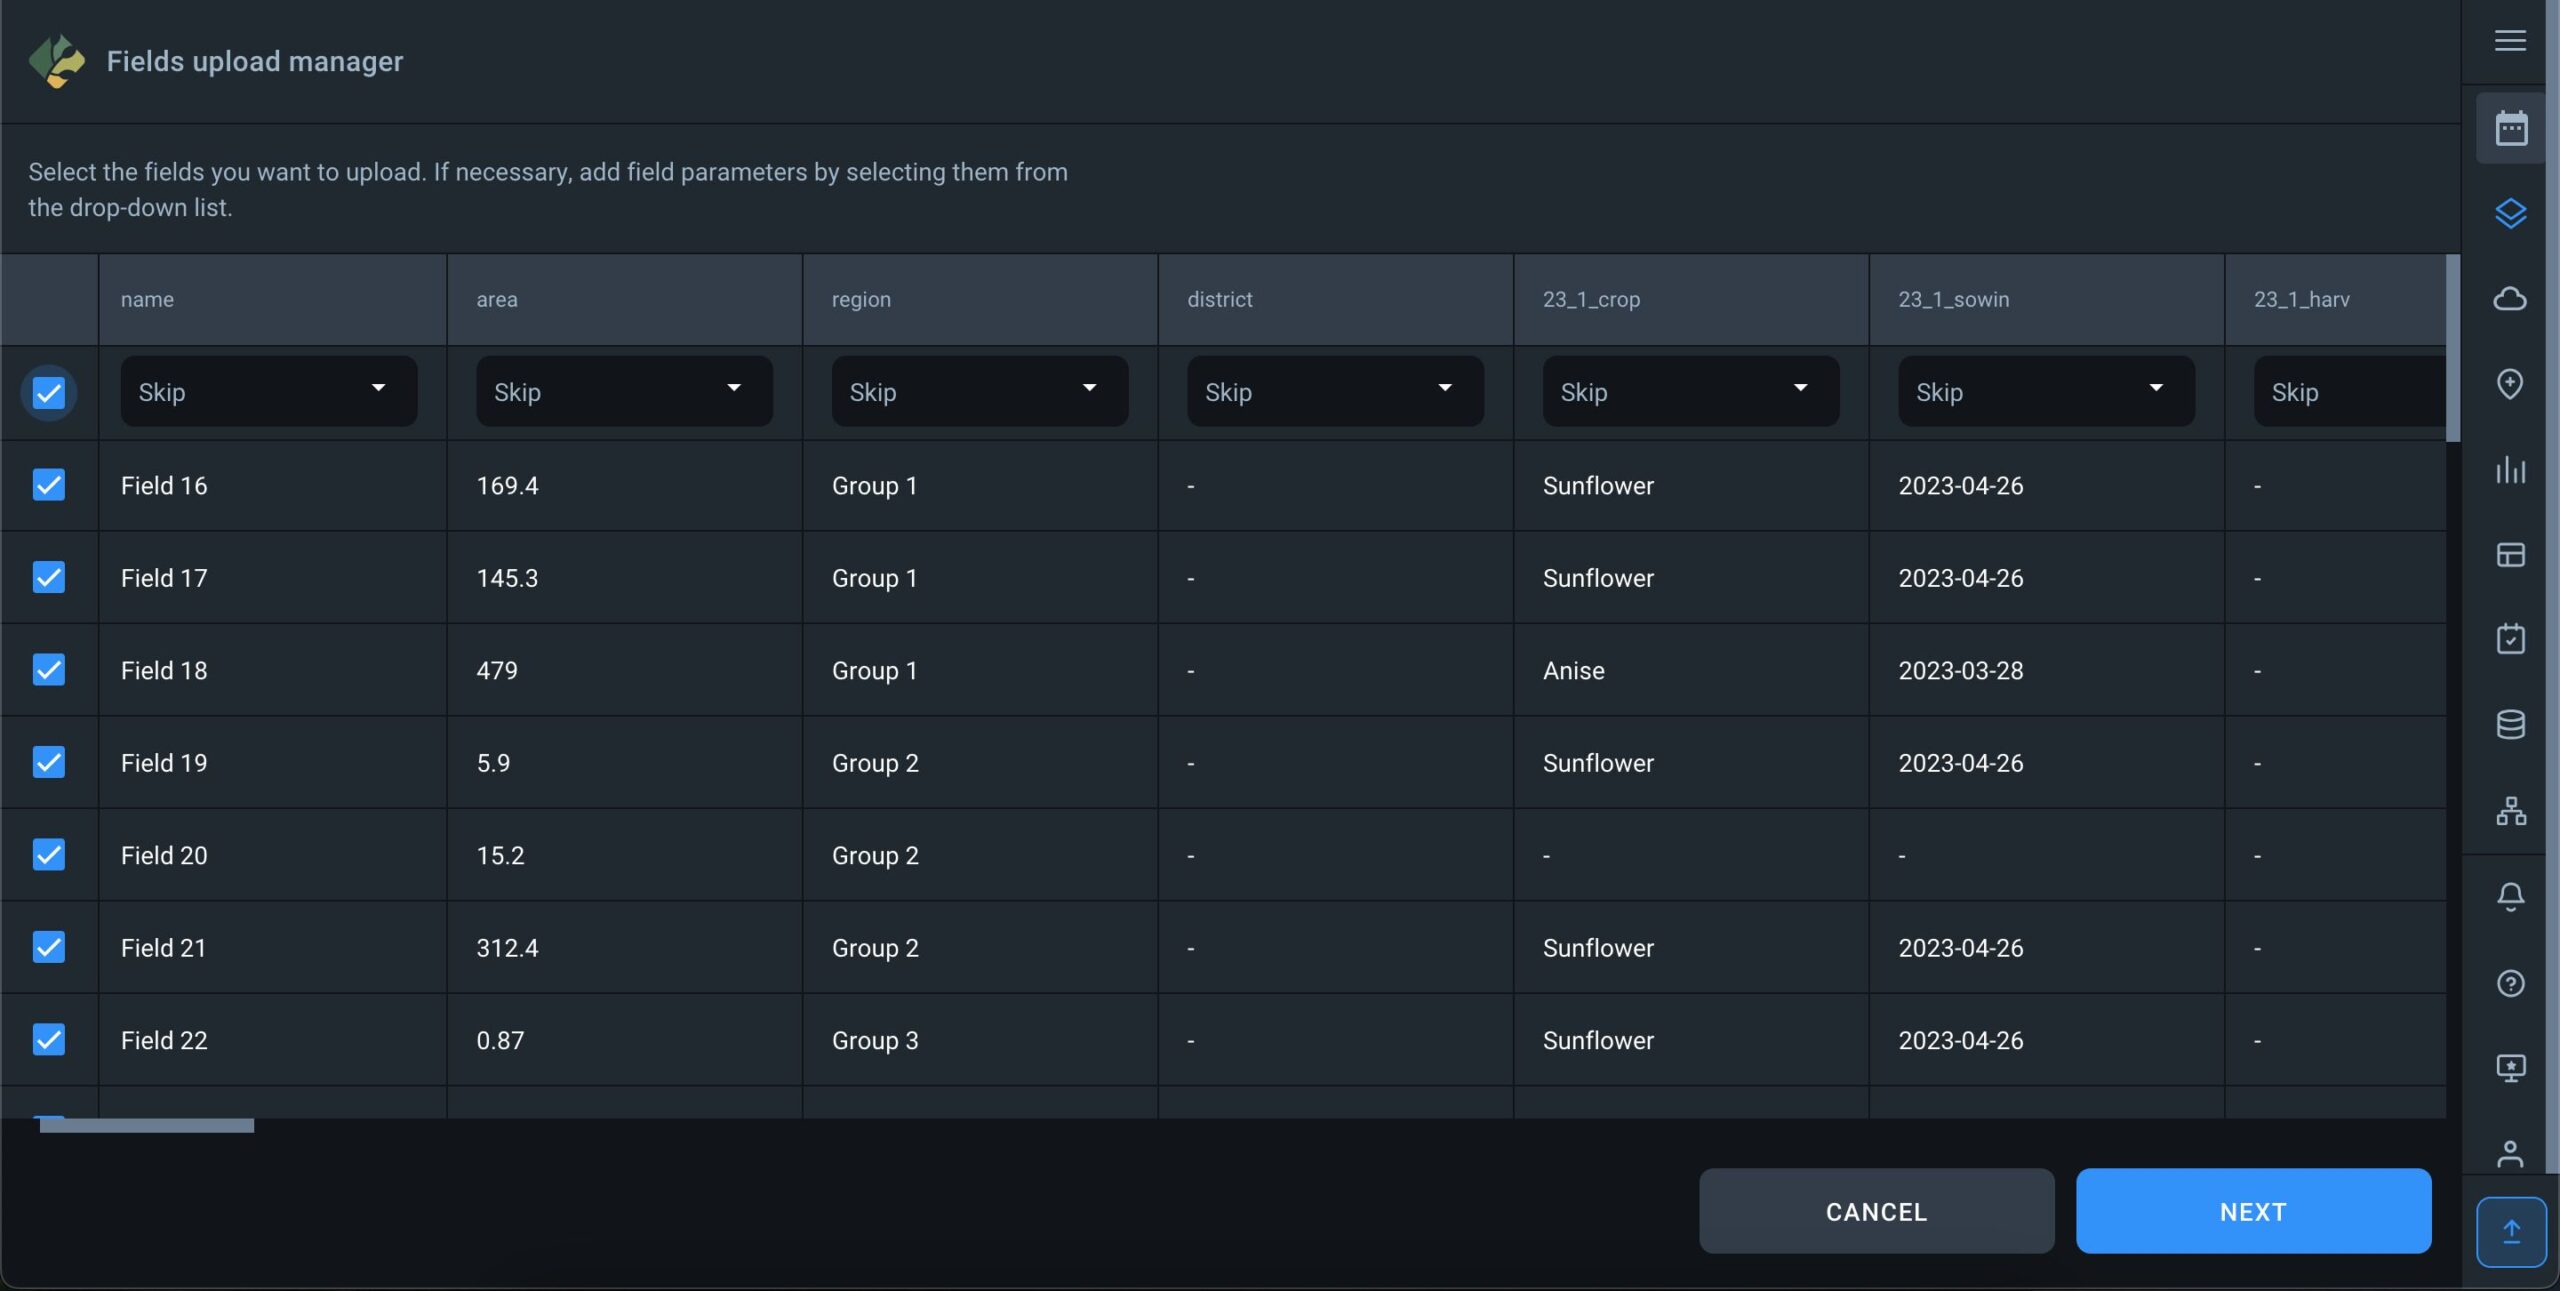
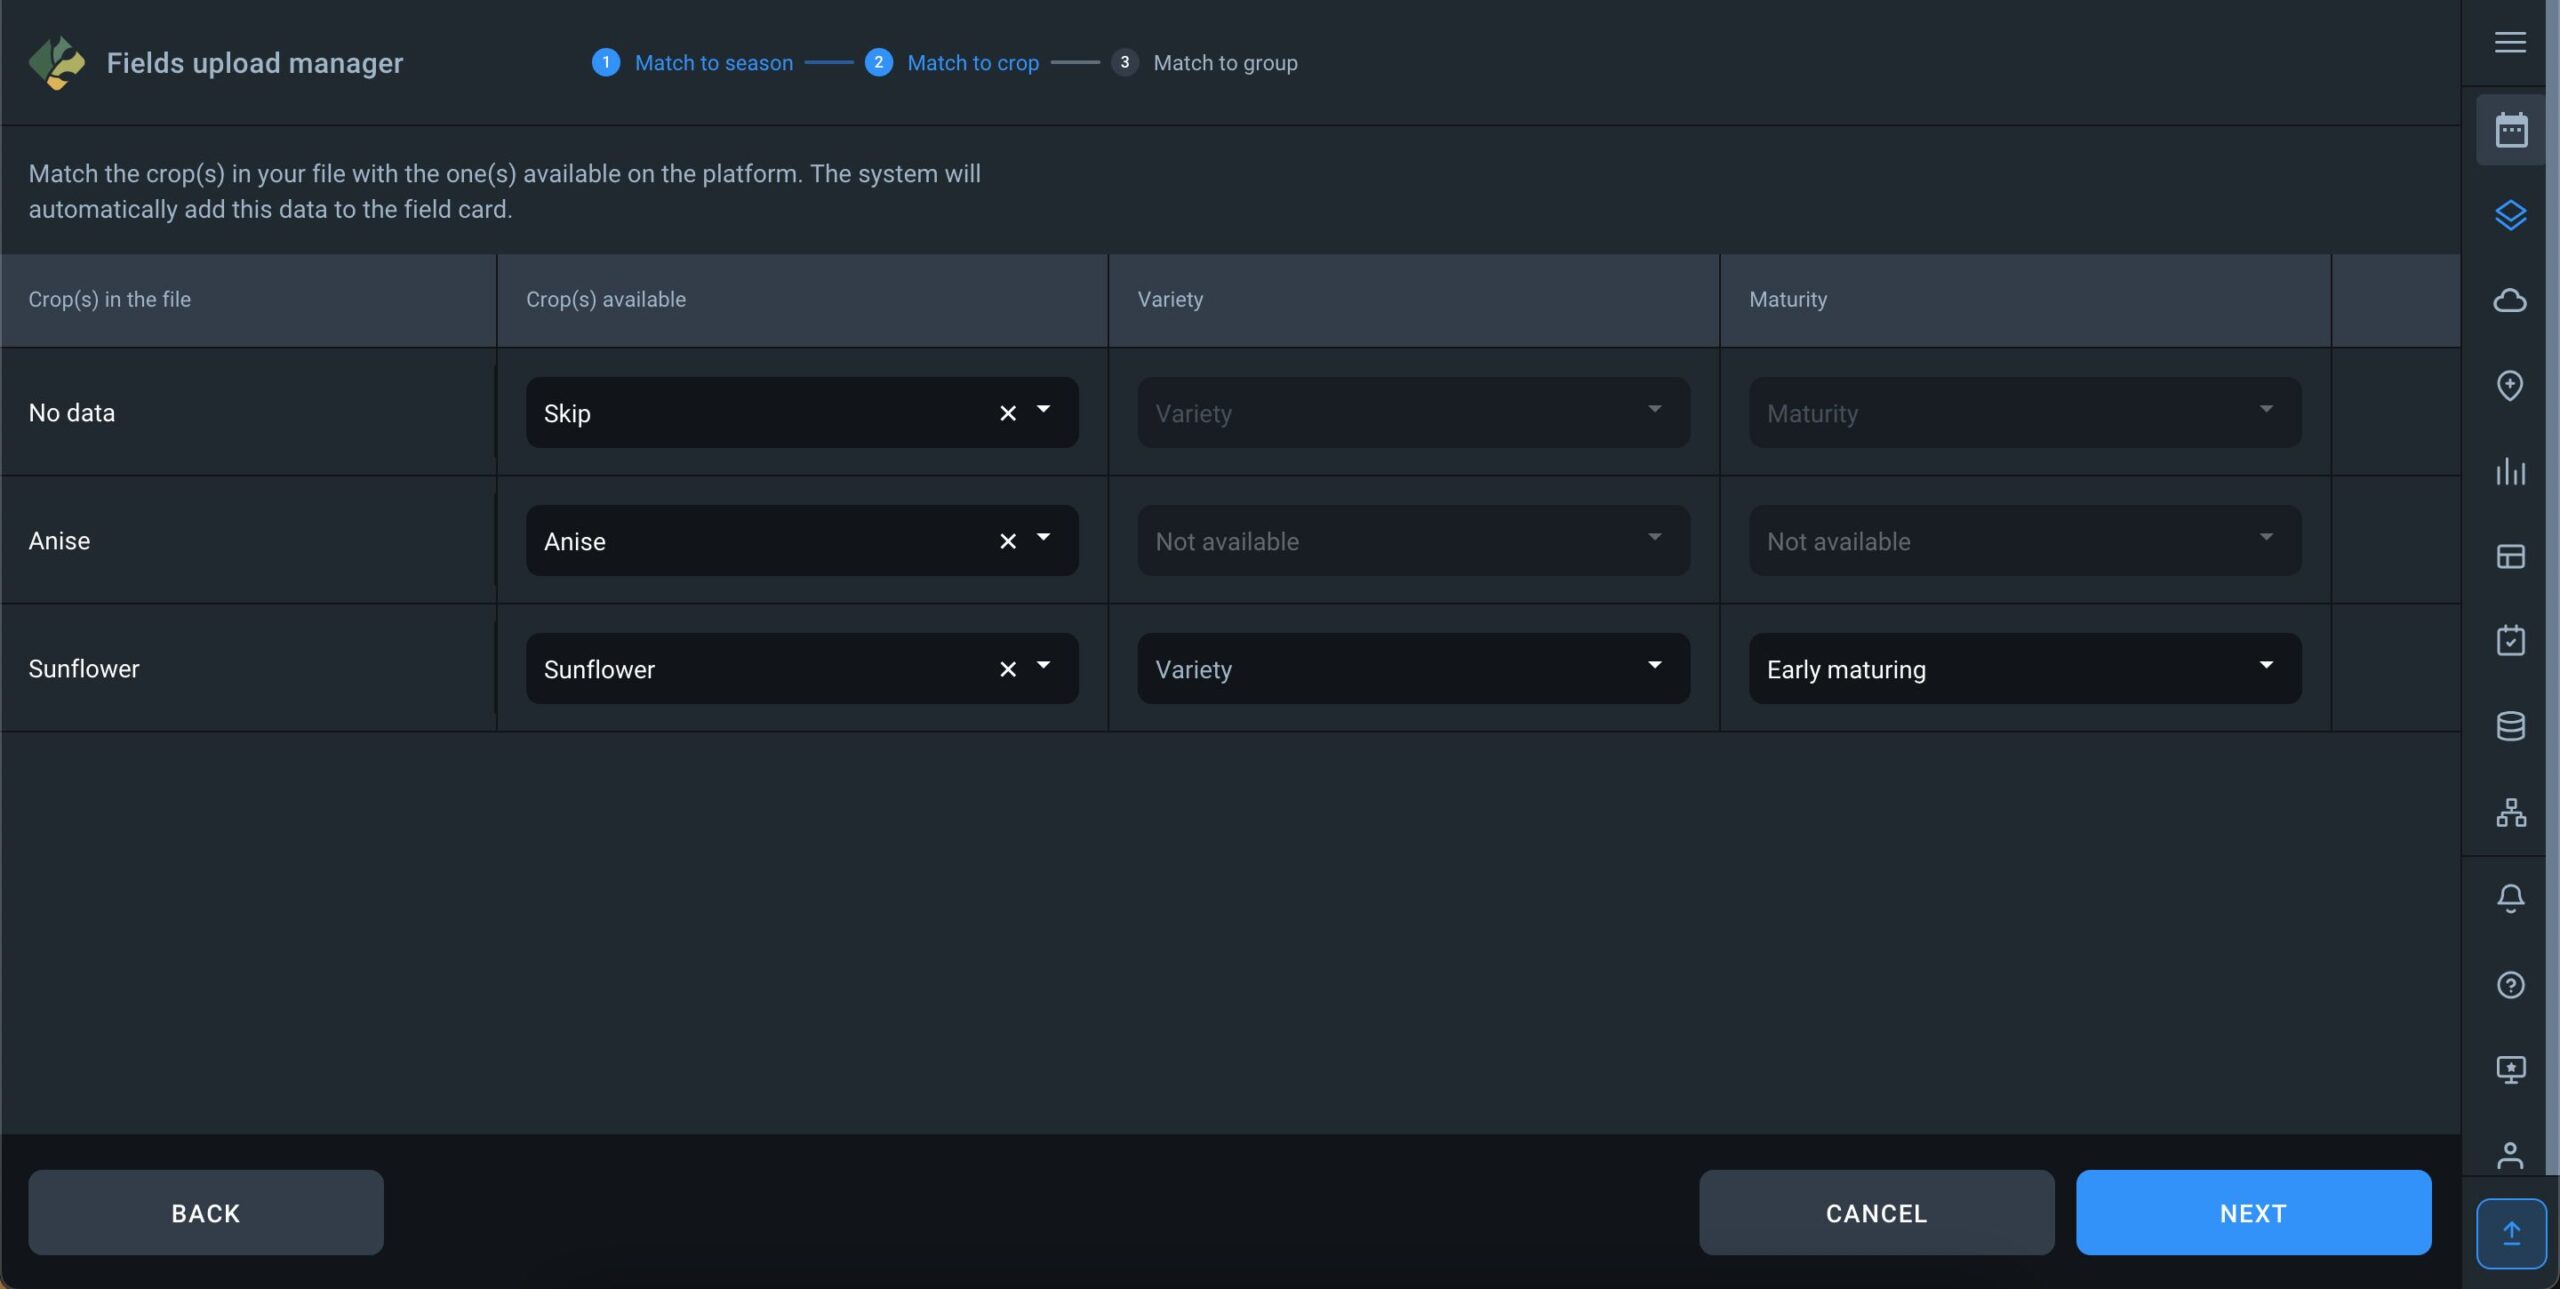
Here you will see the parameters of the fields present in the uploaded file. The system will automatically classify each parameter into a different column. Use a drop-down menu on top of every column to select the correct parameter for each data type. Here you can also select the “Skip” option for those parameters you don’t want to be visible on the platform.
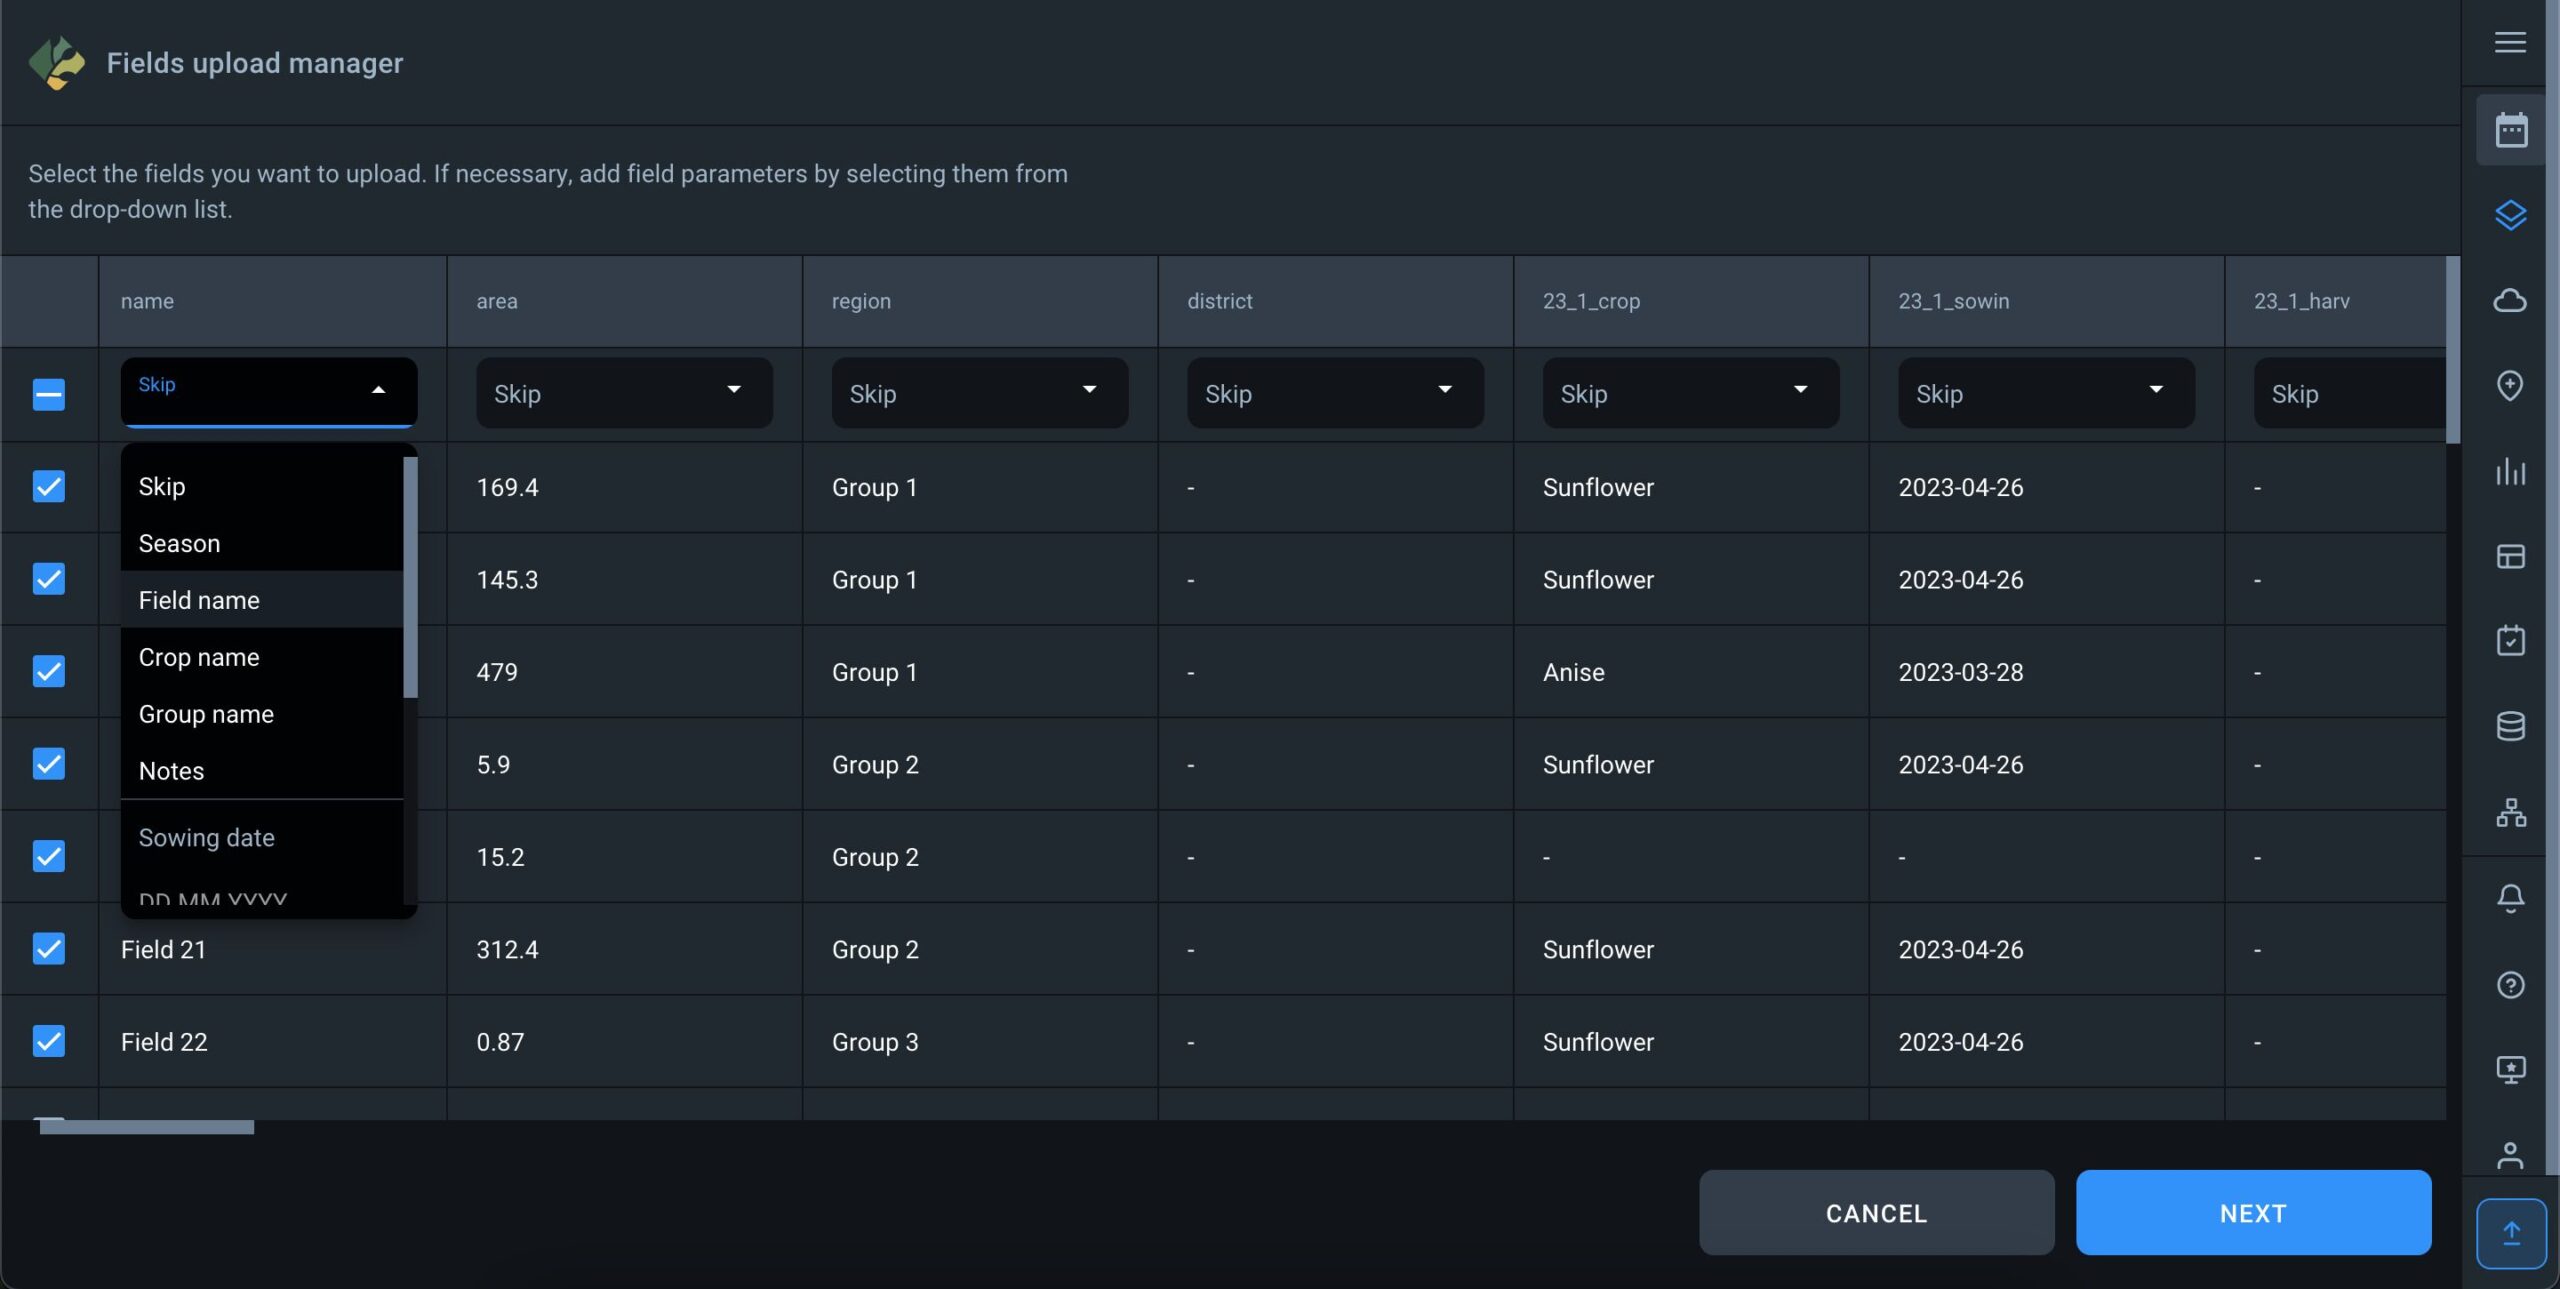
When configuring parameters such as “Sowing date” and “Harvesting date,” it’s crucial to select the date format used in the file to ensure error-free data processing.
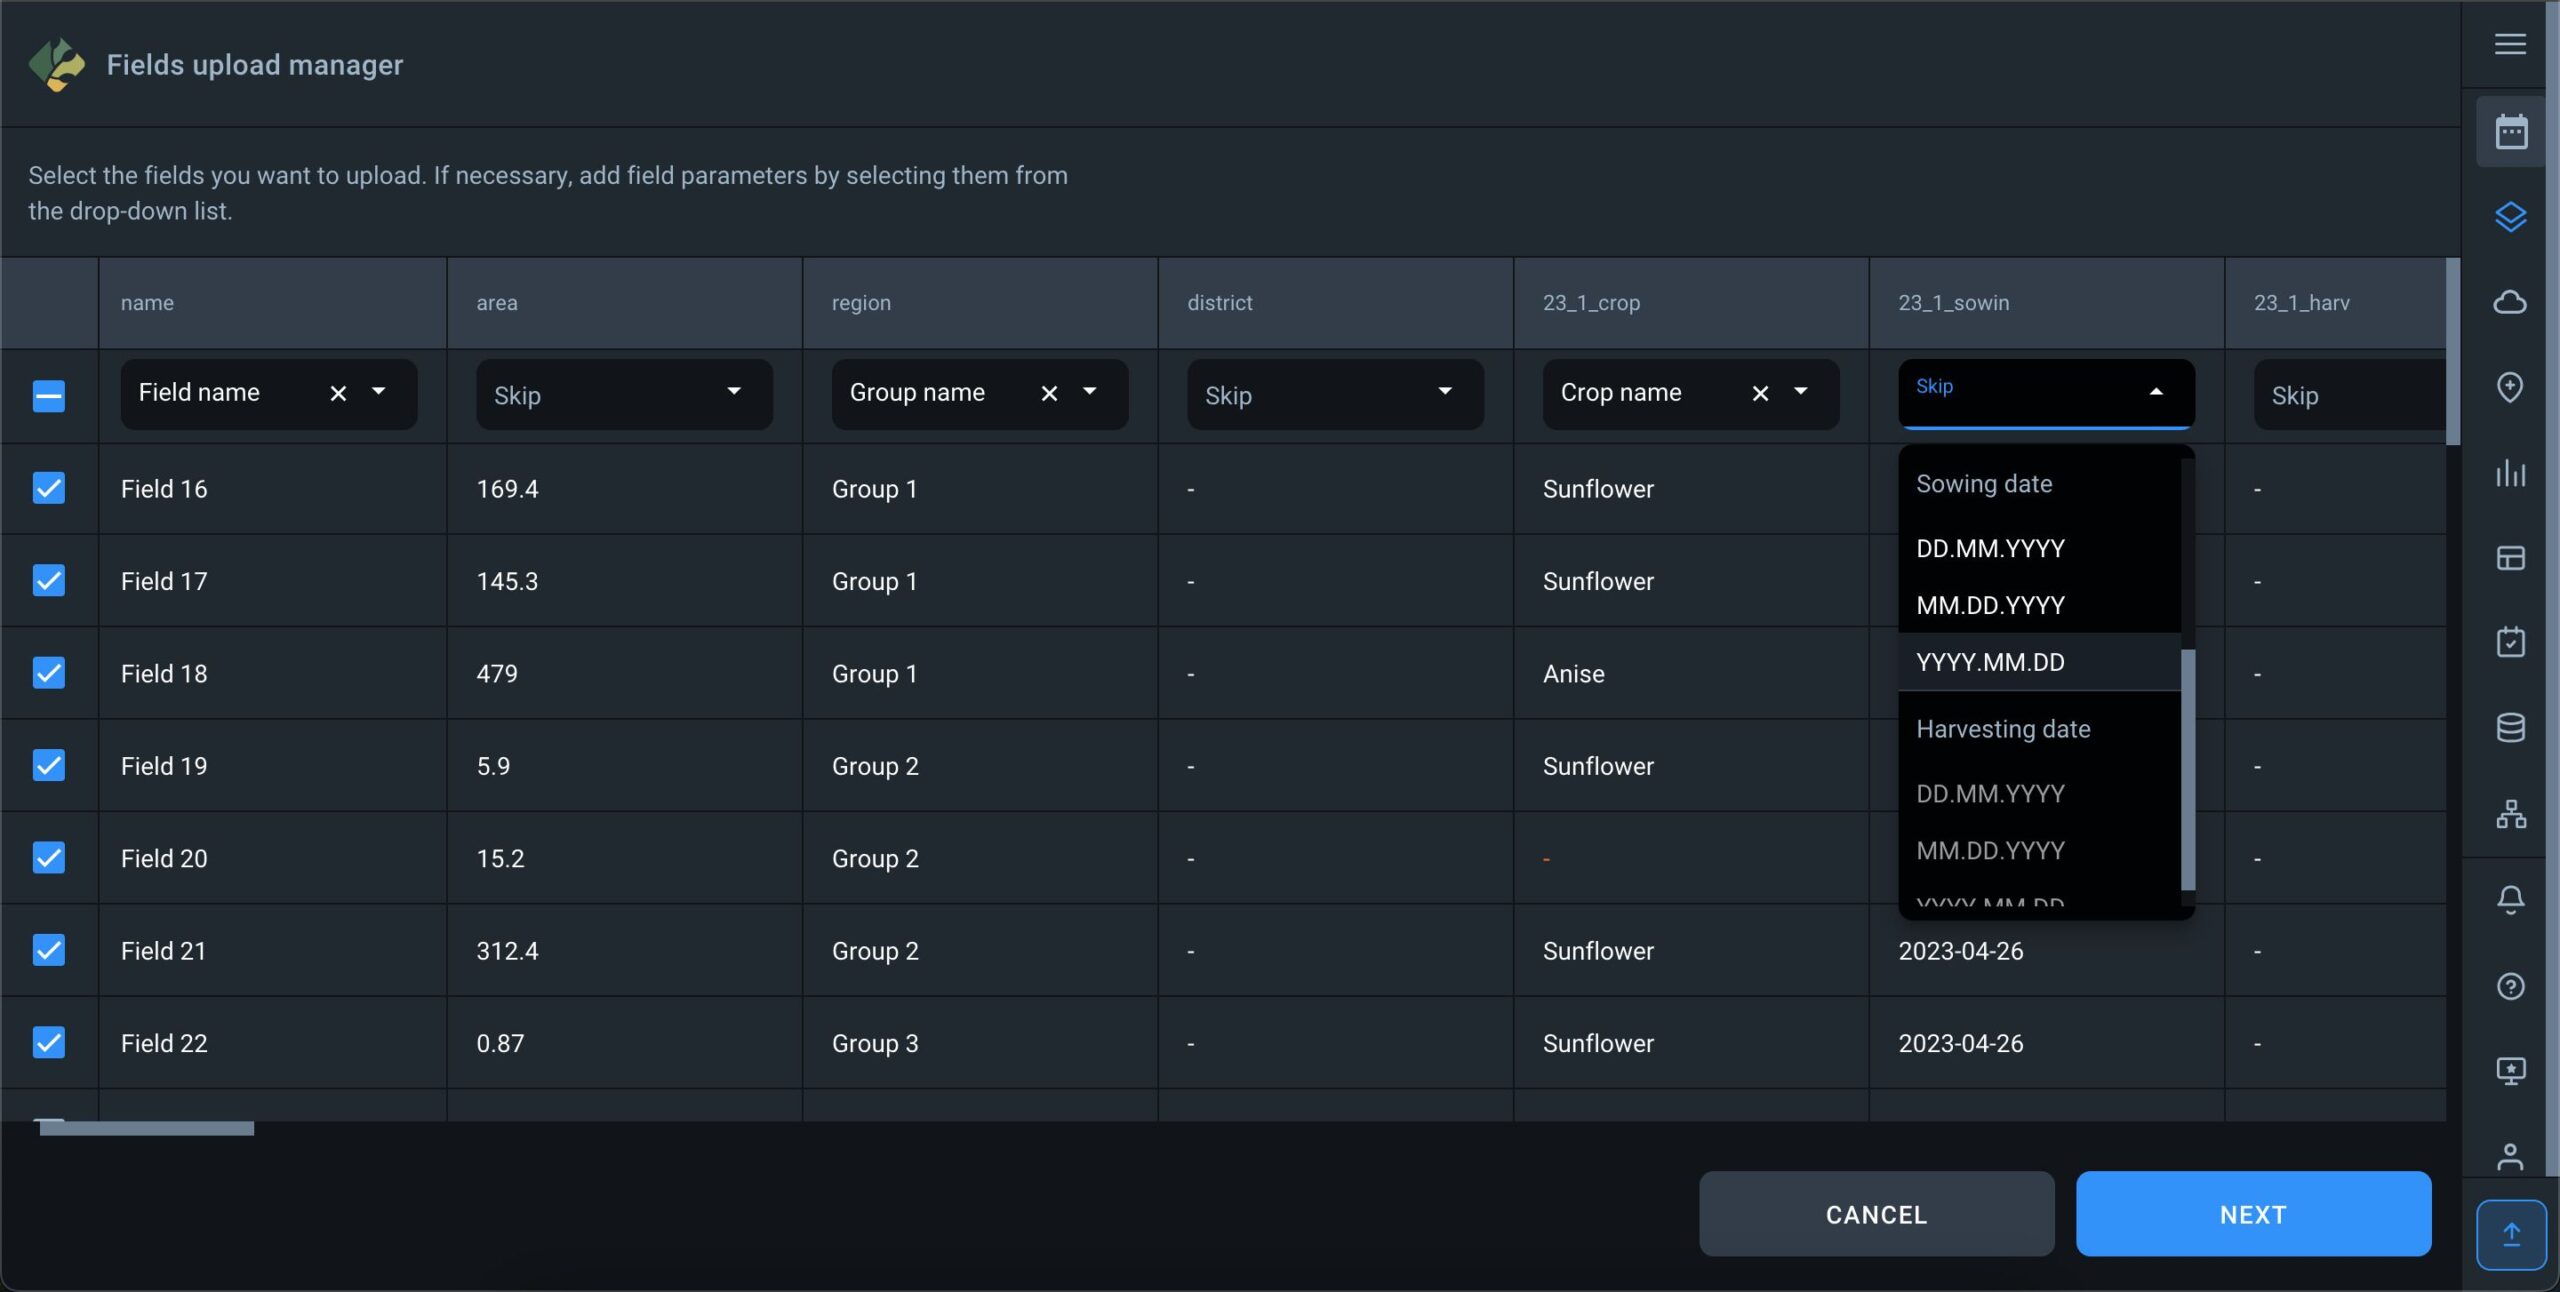
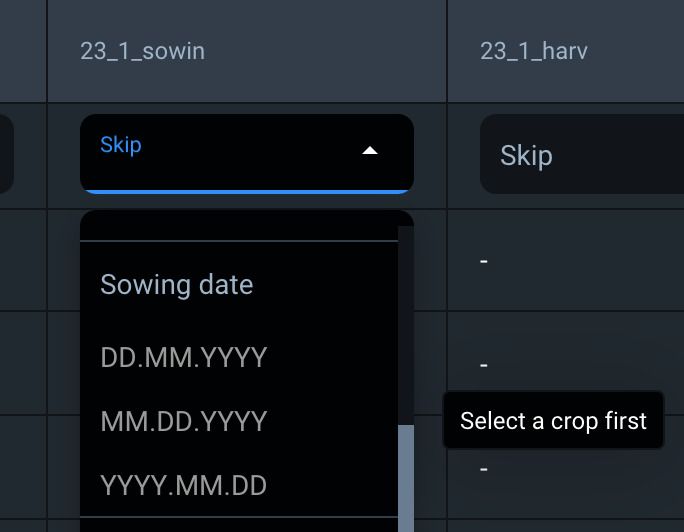
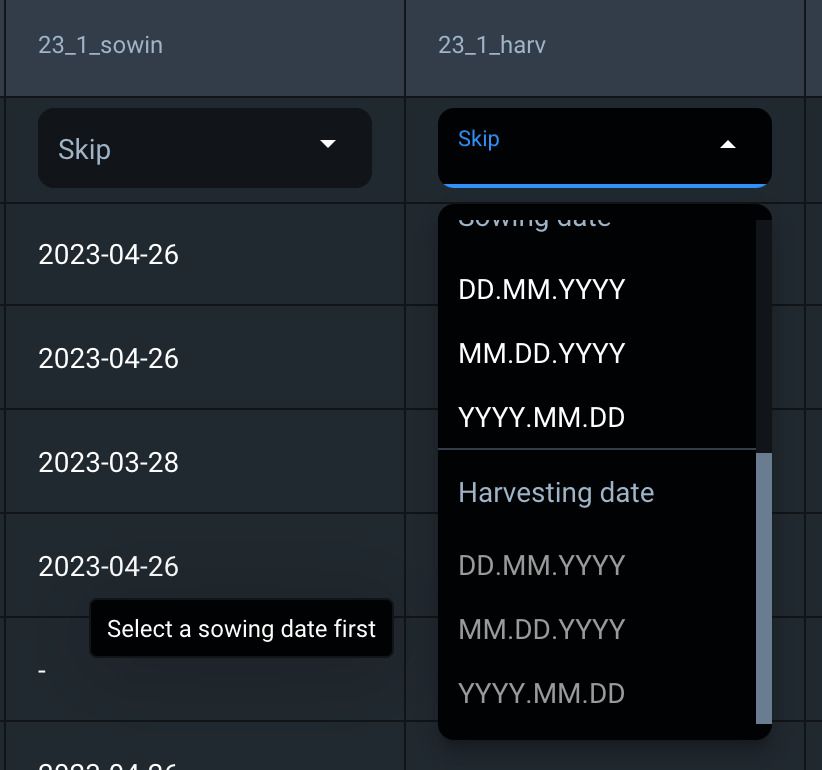
Notice: The selection of the sowing date is only enabled after the crop has been selected, and the selection of the harvesting date is only enabled after the sowing date has been specified.
Sowing date
Harvesting date
After selecting the parameters, you must ensure that the seasons, crops, and groups from the file match the corresponding seasons, crops, and groups on the platform.
For example, in the file, some fields may be associated with the 2023 season, while others may not have a specified season. In this case, the system will generate two season data options: “No data” and “2023” season. You can assign any seasons available in your account to these data options, and all fields will be loaded accordingly.
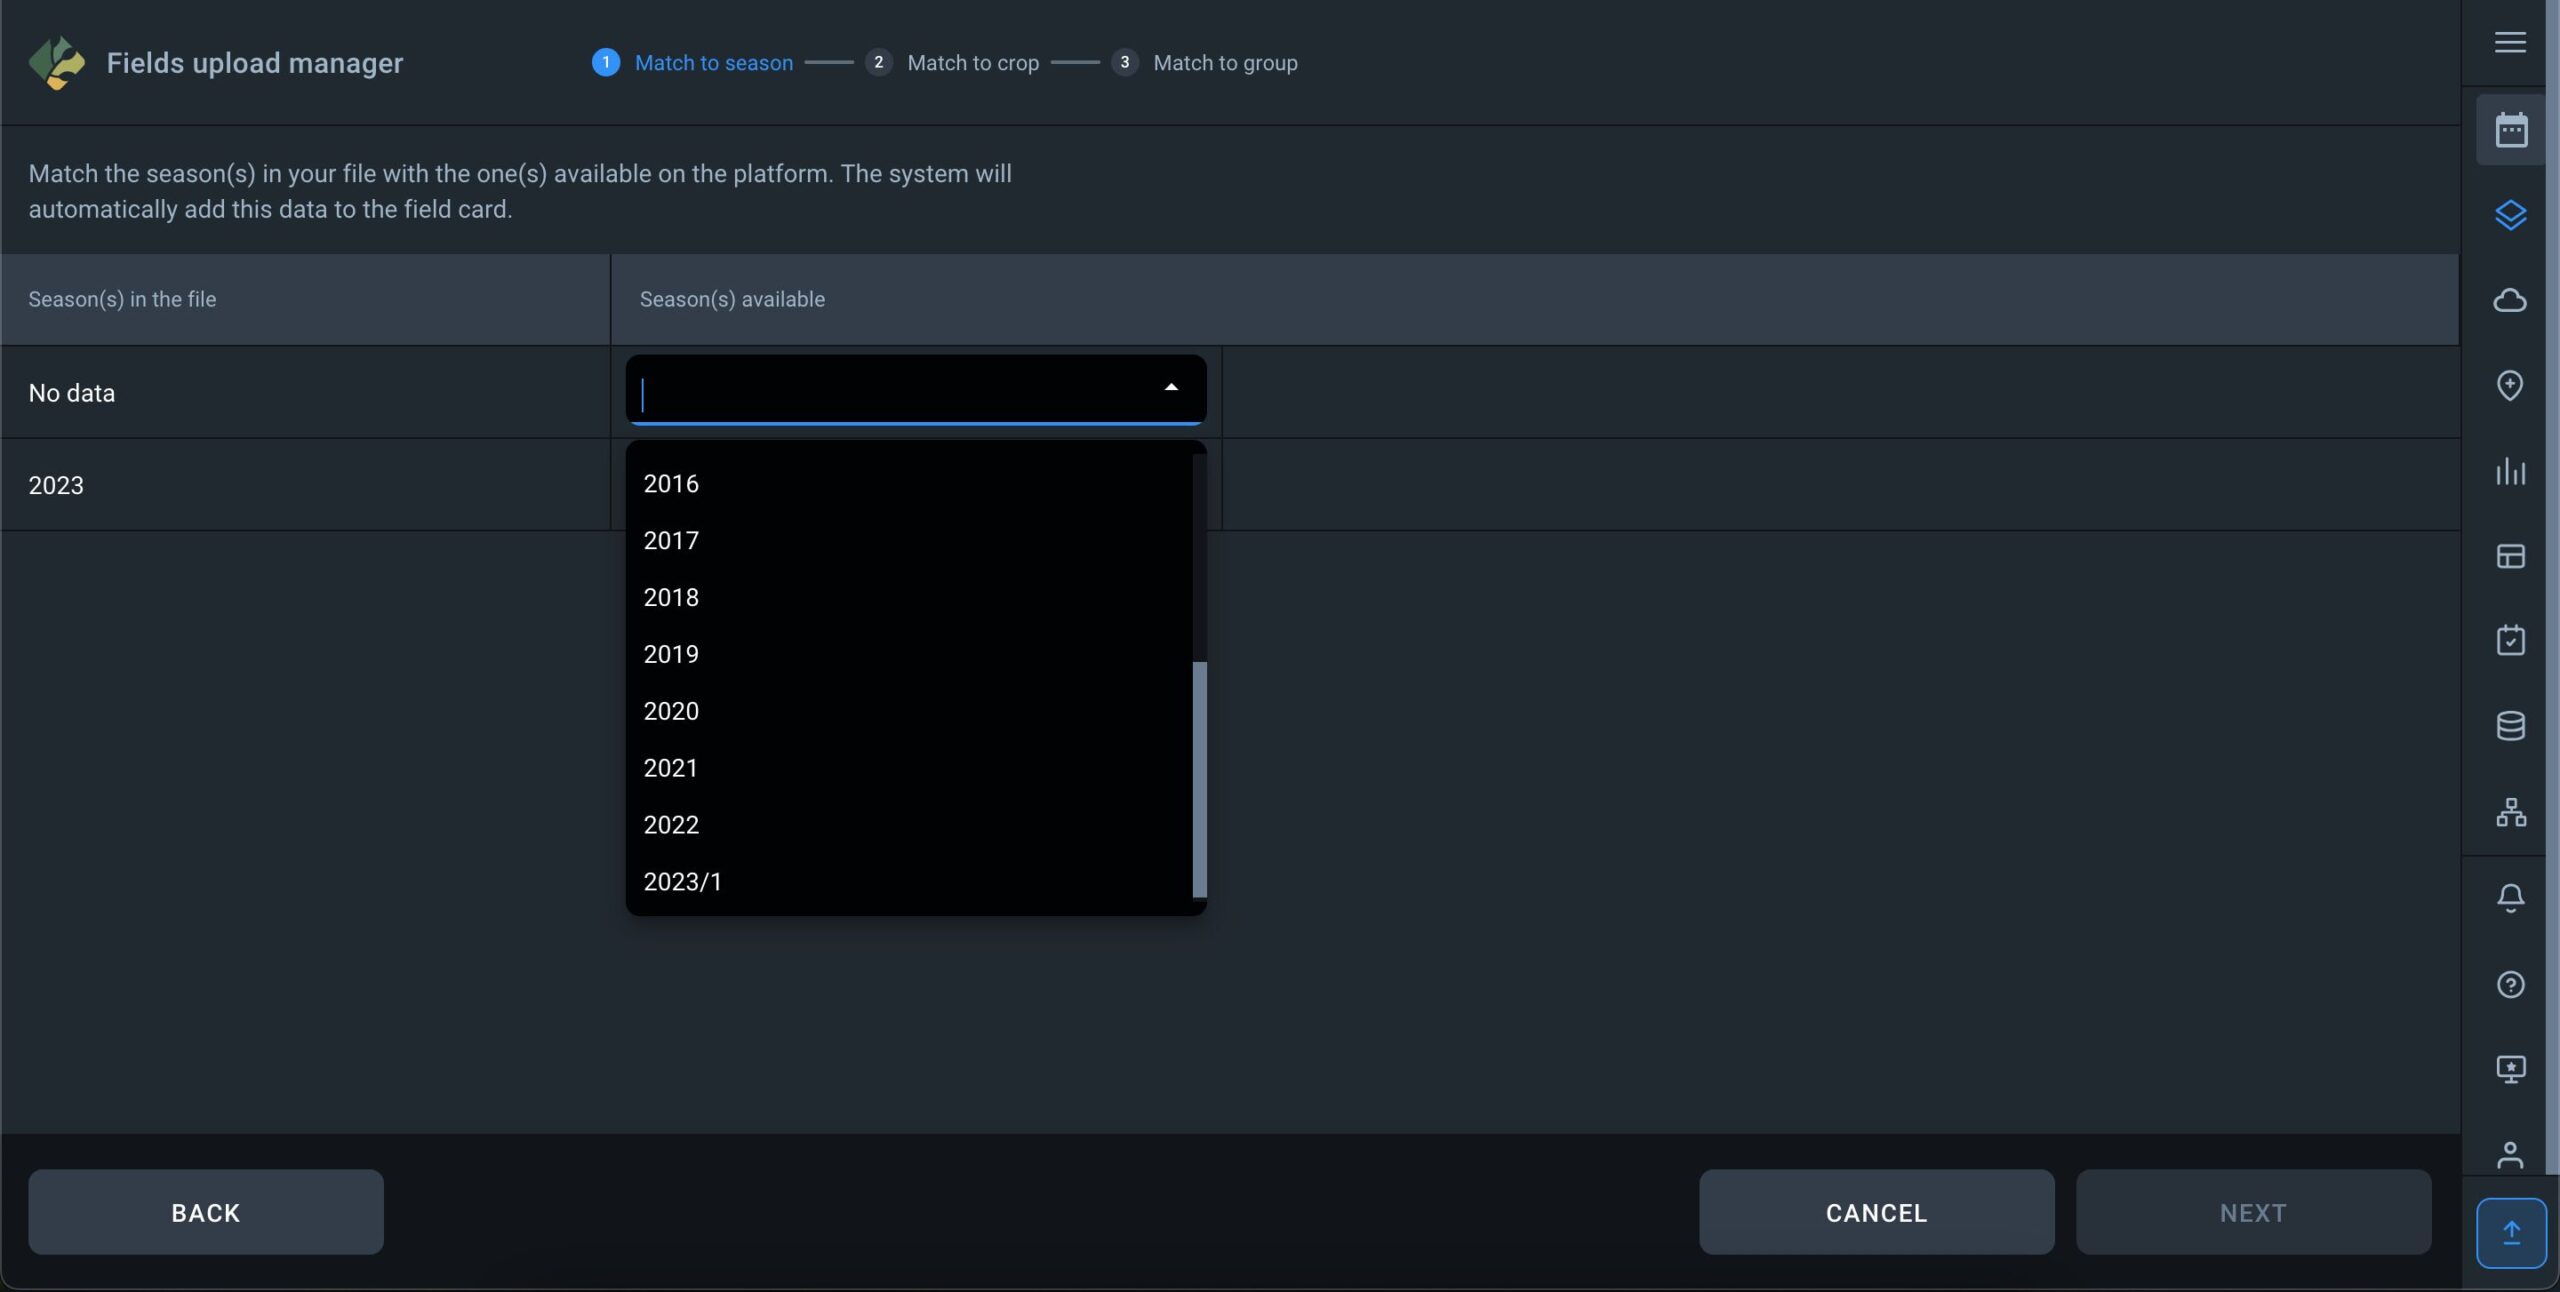
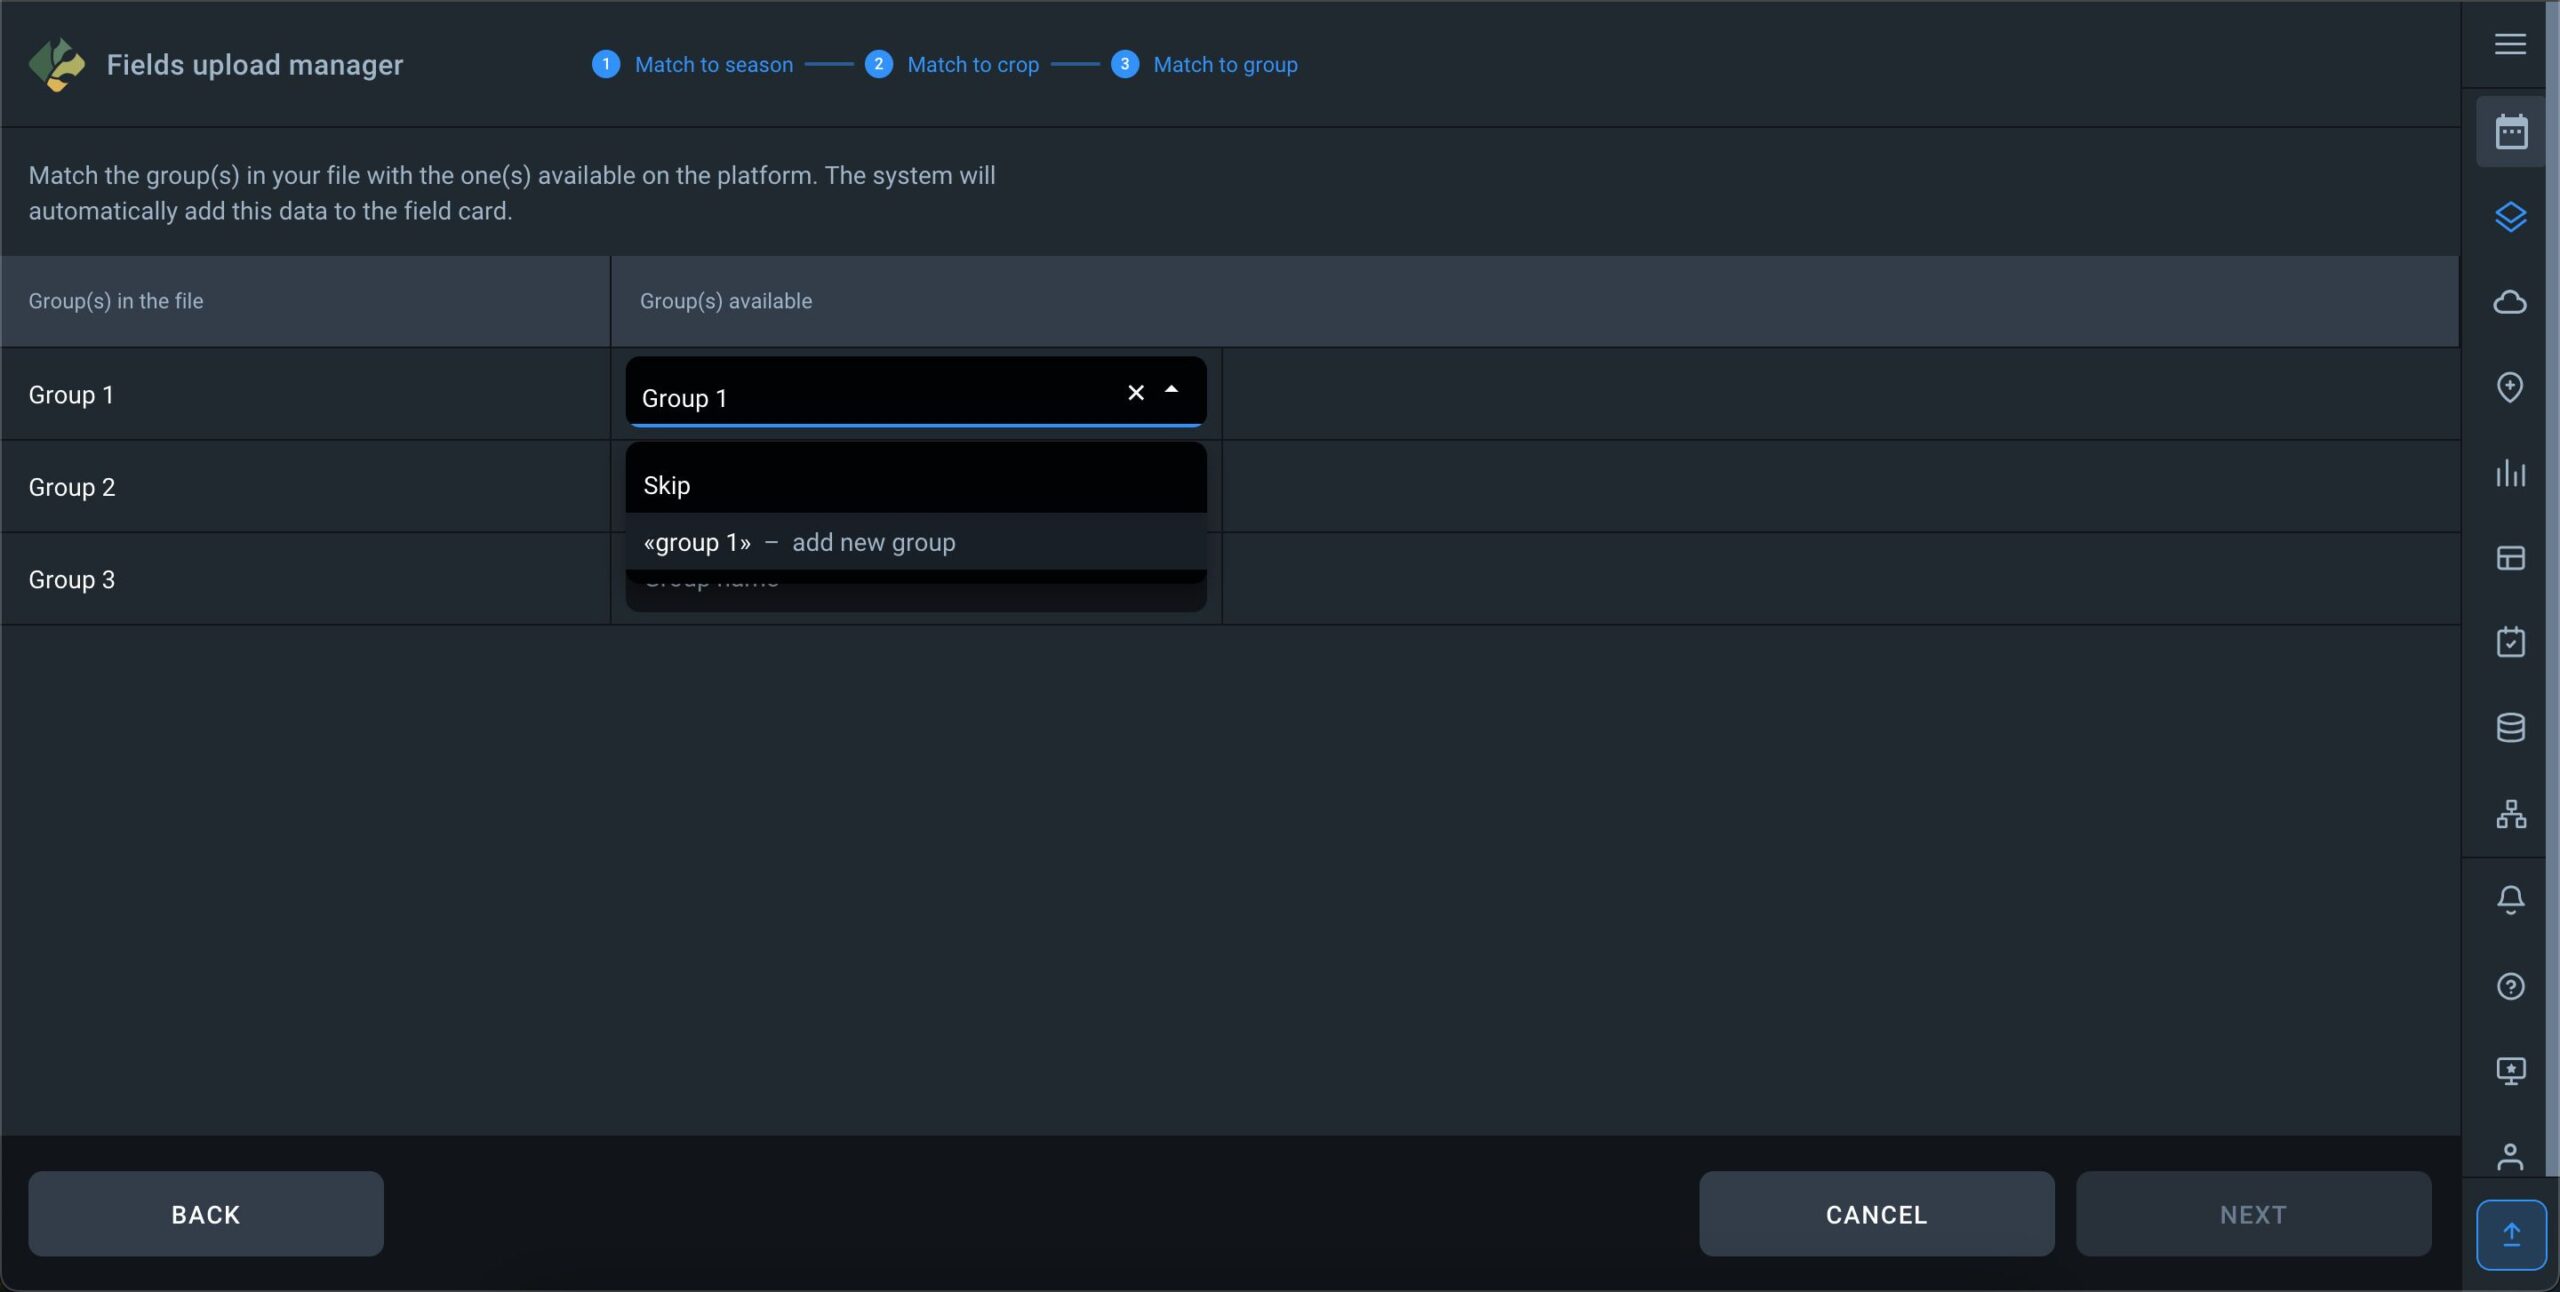
The same logic applies to crops and groups. You can assign crops and groups from a file to existing crops and groups in your account, ensuring that parameters are linked to fields and loaded with the specified attributes.
When specifying groups, you have the option to select an existing group from the list in your account or create a new one. To create a new group, simply enter the name of the group and click “add new group.”
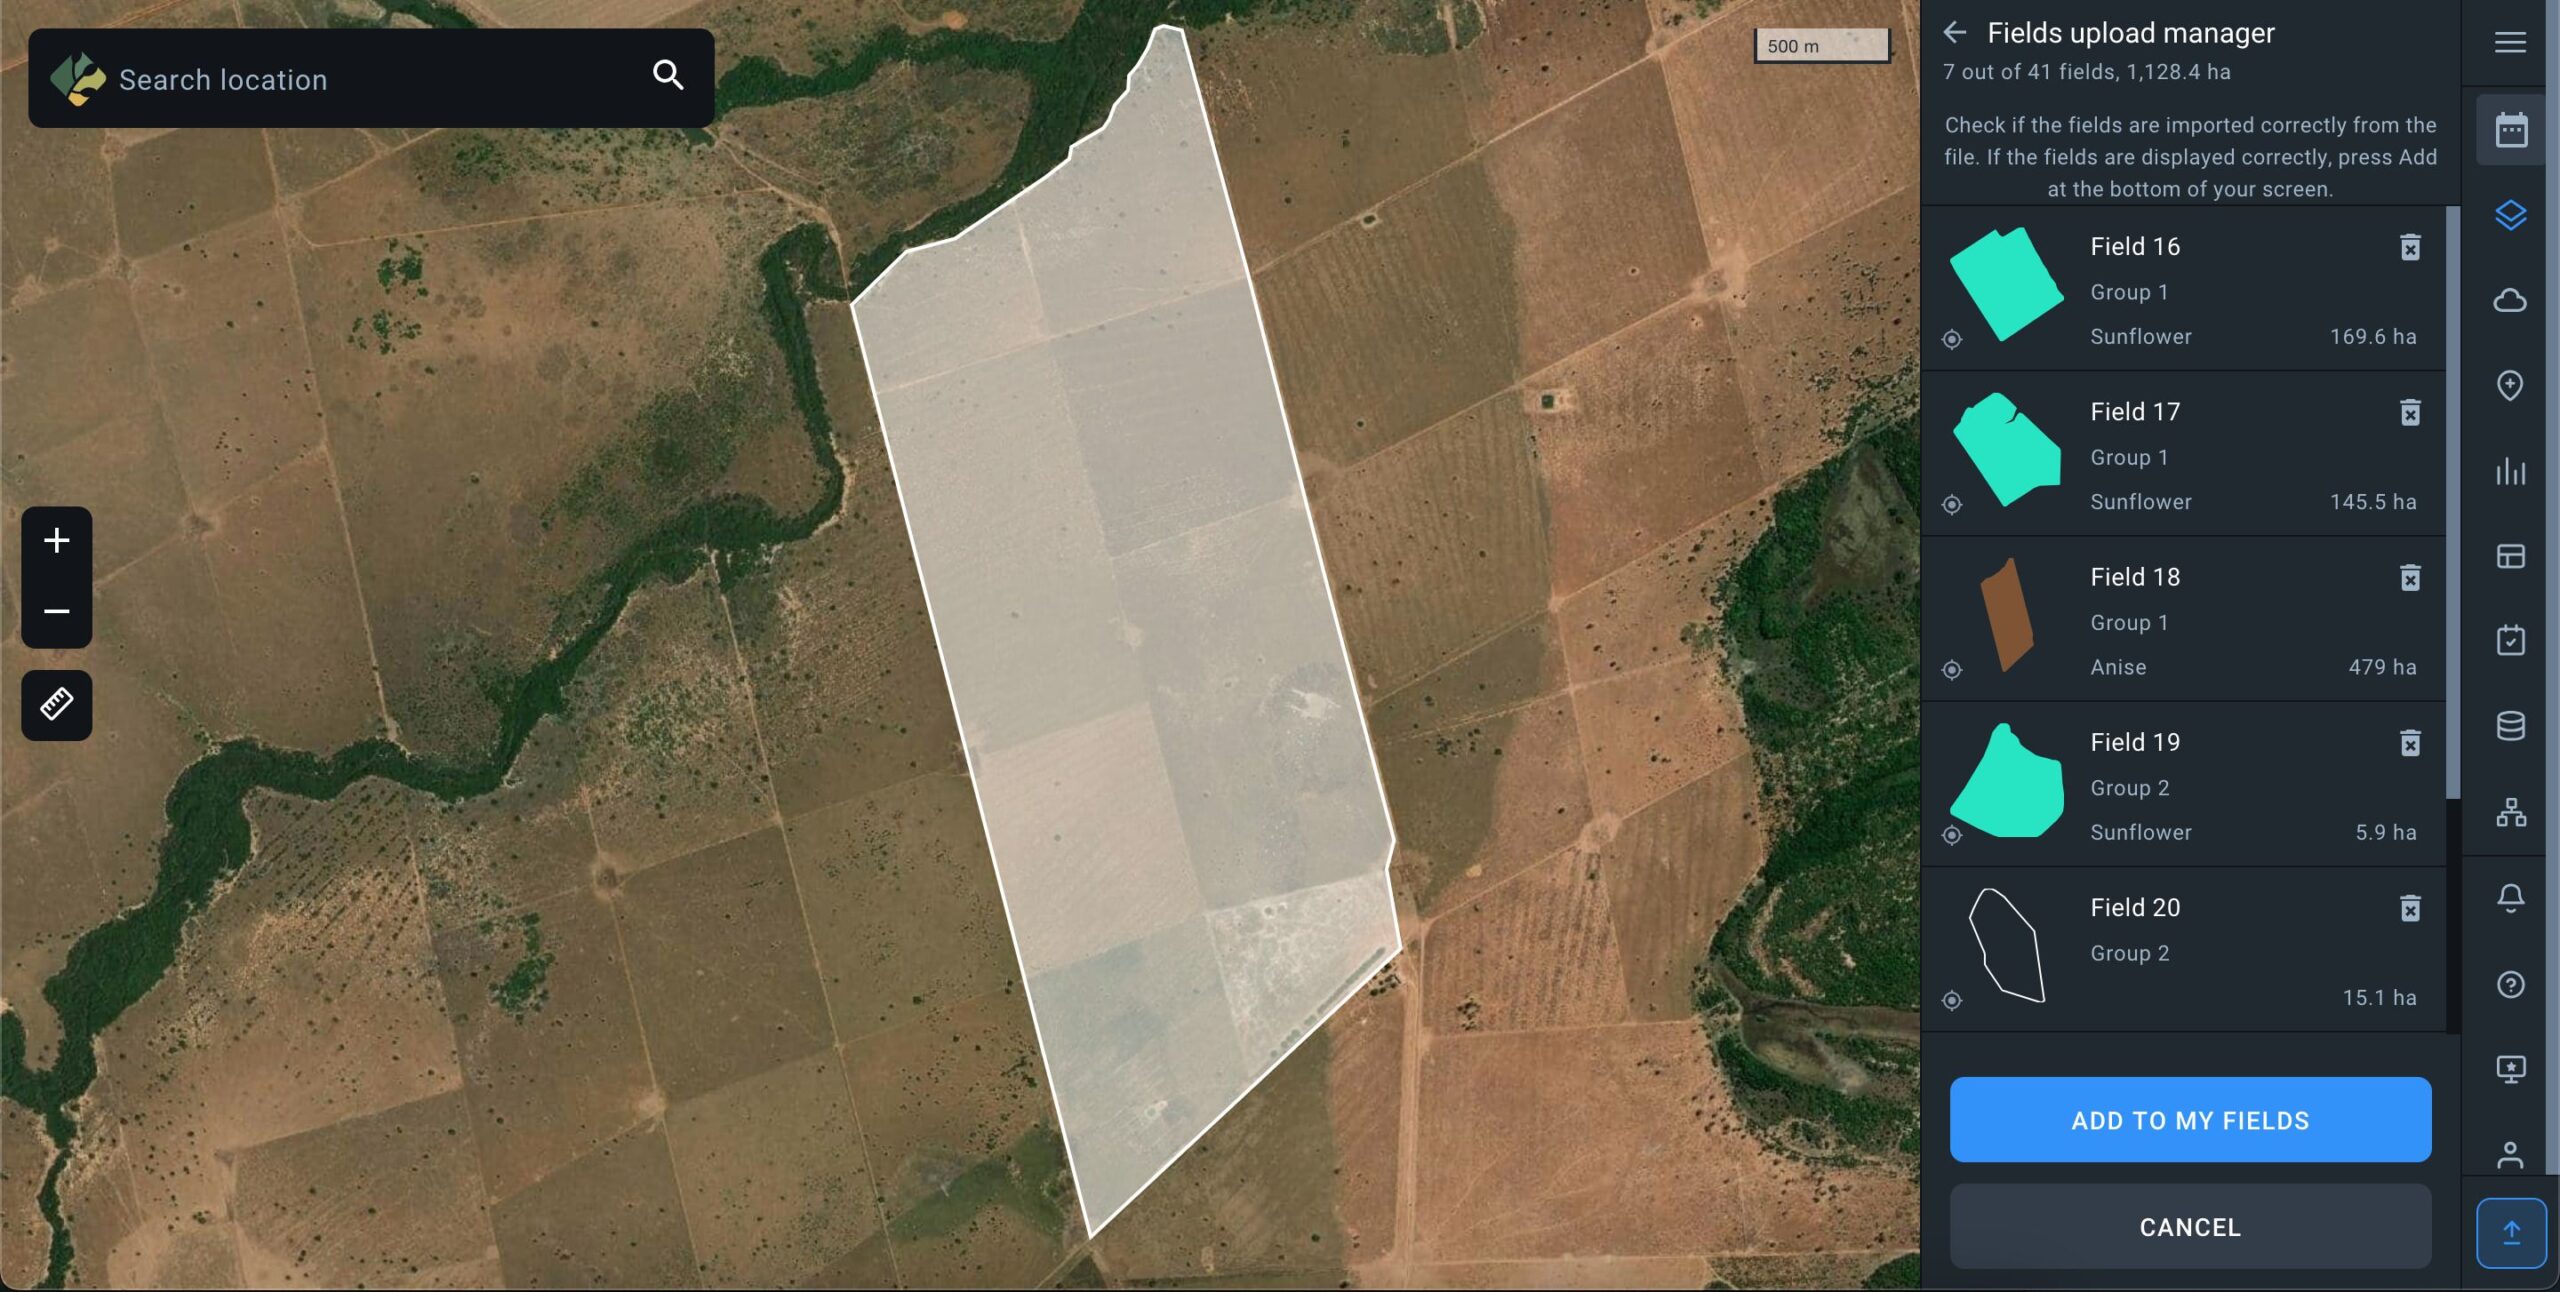
Once all steps are finalized, you will see a map and your field list for the final data verification. If everything appears satisfactory, click “ADD TO MY FIELDS” button, and the fields will be saved with the set parameters in your account, within the seasons you selected during the upload process.
Error types
The .prj file responsible for the coordinate system is missing, please add it and re-upload
The file cannot be uploaded because EOSDA Crop Monitoring cannot determine the coordinates for the fields in the file.
The .shp file requires a .prj file which contains the source product’s coordinate system type.
File format is not supported. Please use formats .shp, .kml., .geojson or zip archive containing the .shp, .shx, .dbf files.
Check the file format, you may be uploading an invalid format or there is an invalid file in the .zip archive
Overview of file formats that can be uploaded in the system:
- SHAPE FILE: A .shp is the main file where the field geometry is stored, it is mandatory. .shx is the index file where the index of the geometry of the fields is stored, it is mandatory. The .dbf file is a table that contains the attributes of the fields (field name, culture, etc.), it is mandatory. Equally important is the .prj file which stores information about the coordinate system.
- KML FILE: A .kml is a file that contains all the elements of a layer or map – object geometry, conventions, descriptions, attributes, images, and other valuable information.
Note that only the object geometry (polygon shape made of minimum 3 points) can be uploaded into EOSDA Crop Monitoring. - GEOJSON: The .geojson format can store primitive types of geographic object descriptions, such as: points (addresses and locations), lines (streets, highways, borders), polygons (countries, states, parcels of land). This file can also store the so-called multitypes which are an amalgamation of several primitive types. Note that, among all the objects contained within this file, only polygons can be uploaded into EOSDA Crop Monitoring.
- ZIP FILE: You can use a .zip archive to upload files that are part of the shapefile structure, specifically .shp, .shx, .dbf, .prj.
Polygons were not found in the file. Note that separate lines and dots are not supported. Only polygons are recognized by the system.
This error occurs when the file you’re trying to upload is not a polygon shape but alabel, a point, a photo, a line, a road or some other unsupported element.
On EOSDA Crop Monitoring, you can only upload the files containing a polygon shape, i.e. an object in which there are at least three connected coordinate points all connected to each other.
File size exceeds 10 Mb. Split it into smaller files
The error occurs when the file that’s being uploaded exceeds 10 Mb. You can solve the problem by archiving the file in .zip, if it is a shape file. If .zip, .kml or .geojson files exceed 10 Mb,, – the most likely explanation is that there are too many objects (fields) contained within the file, and it is better to re-save these fields from your source by distributing them among 2 or more files.
The field has intersecting contours which are not supported, please fix it
This error tells you that the contours of some of the fields contained within the file overlap (intersect or cross each other), which does not allow for polygons to be correctly created on EOSDA Crop Monitoring. You need to review your fields and their contours at the source from which you are exporting them.
The field exceeds 10,000 ha / 24,710 ac, please resize it or draw a new one
The error occurs when the area of the field whose contours you are trying to upload as a polygon shape is larger than 10,000 hectares or 24,710 acres. You need to edit the contours of the polygon at the source or draw the contours manually on EOSDA Crop Monitoring.
Adding a Field Boundary by Drawing
When you navigate to the field drawing page, the boundary drawing tool is active by default.
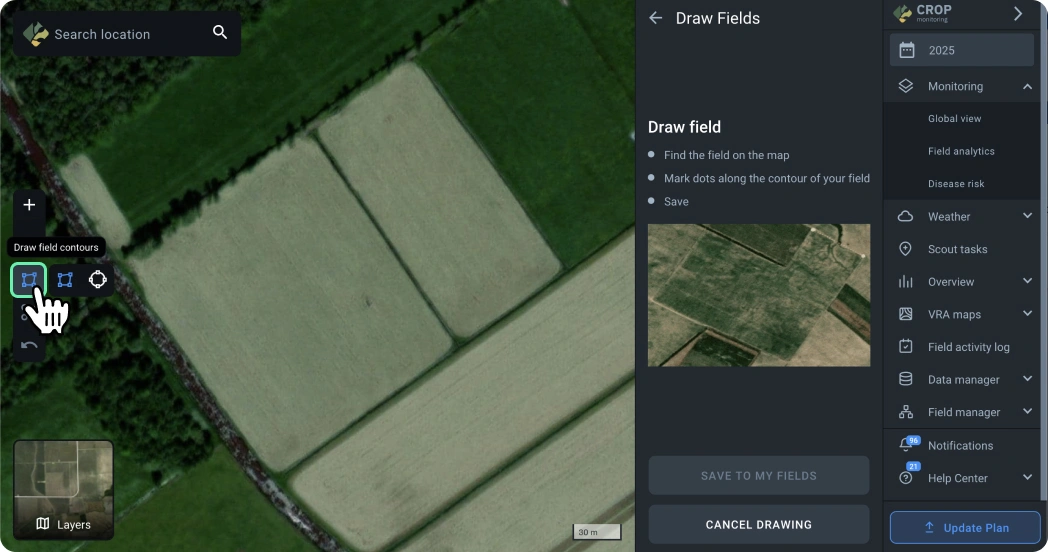
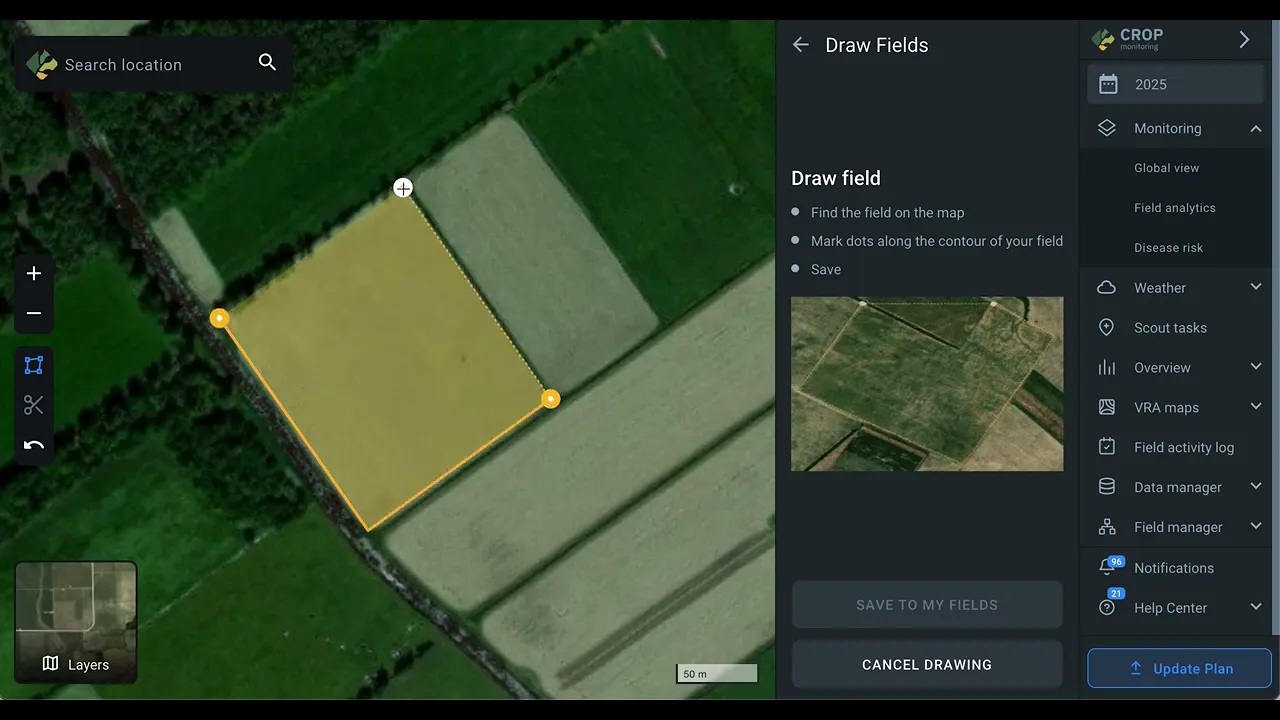
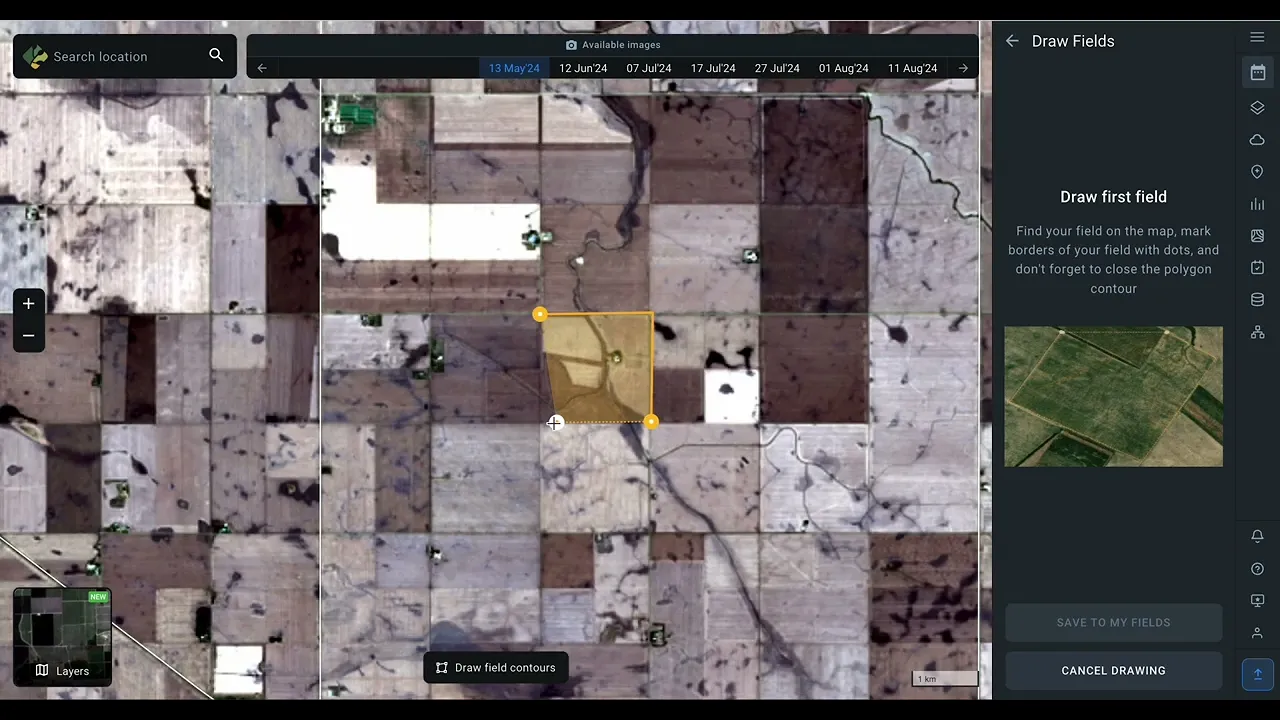
You can start drawing a field boundary by placing the first point on the map.
To finish drawing the boundary, close it by double-clicking on the first point.
To complete the drawing, the boundary must have at least three points.
Once the boundary is complete, you can save the field and proceed to the analytics section to access vegetation indices and other data.
After finishing the drawing of one field, click on the drawing tool button to create another boundary, just as you did with the first one.
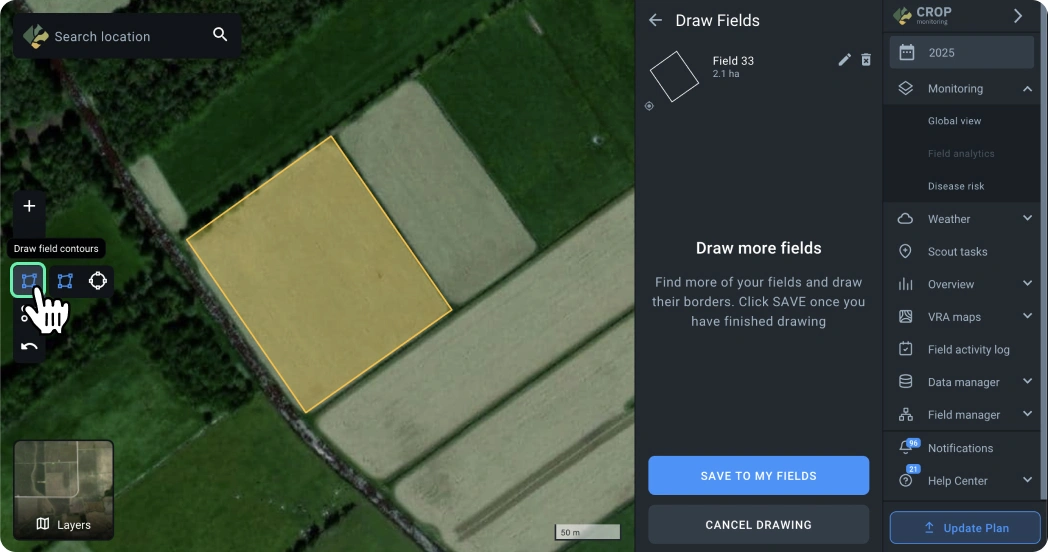
This way, you can add multiple fields at once to obtain data for analysis.
Once you finish drawing all the required boundaries, don’t forget to save them to your field list for further work with those fields.
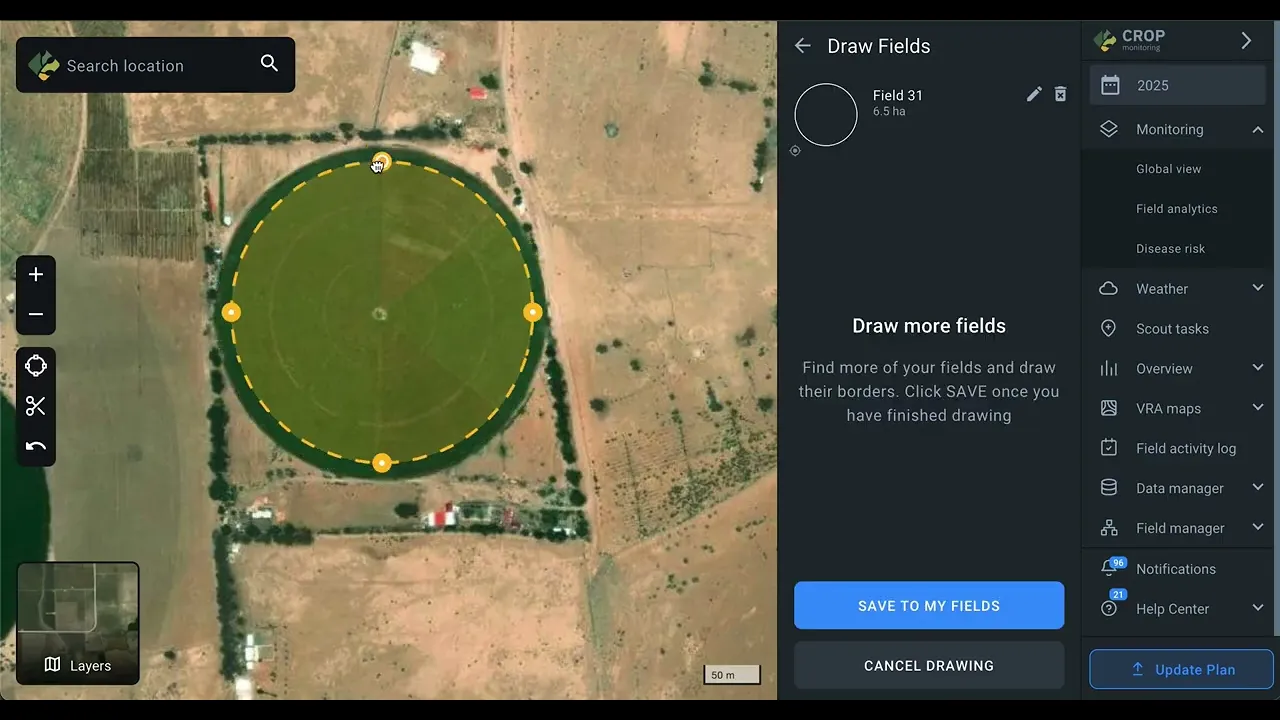
🟢 Drawing Round Boundaries
Use the “Circle” tool to add a circular field boundary.
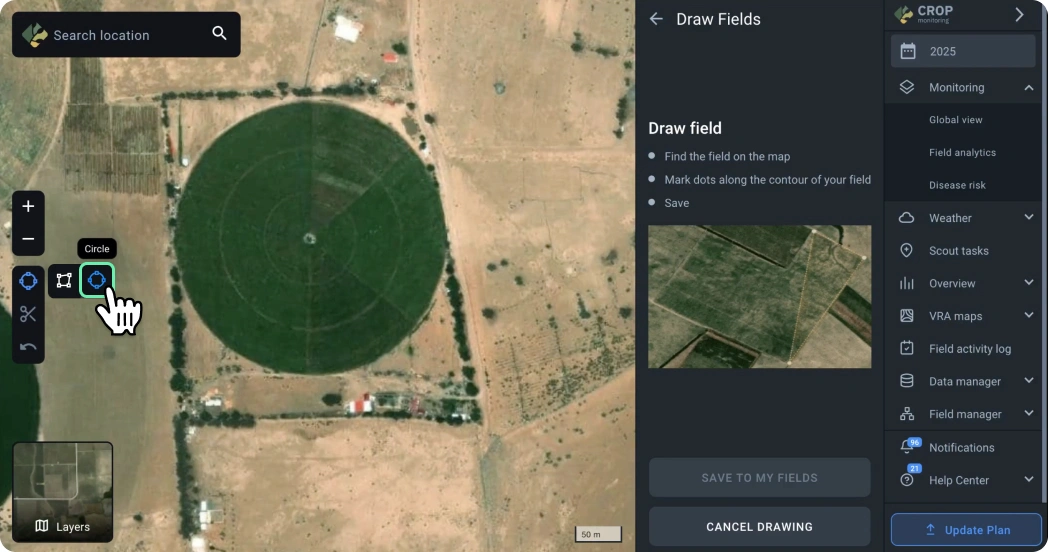
To create a circular boundary, place a point at the center of your field and stretch the circle to the desired size.
You can adjust the boundary size by dragging one of the four points.
✂︎ Cutting Parts of a Boundary
Using the cutting tool, you can remove unnecessary areas from your field boundary, such as buildings, ravines, roads, or zones not currently used for planting.
This will help you obtain more accurate vegetation data for your field.
To cut a part of the boundary, activate the cutting tool by clicking the appropriate icon.
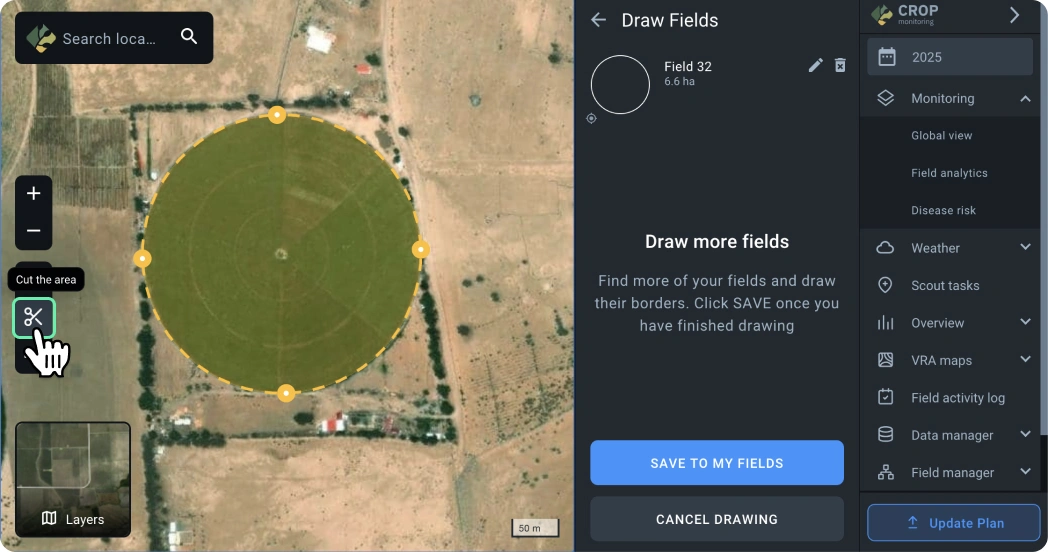
Next, draw the contour you want to cut by placing the first point and subsequent points, closing the contour.
Once the contour is closed, it will be cut from your field, and the field area will be recalculated.

Layers
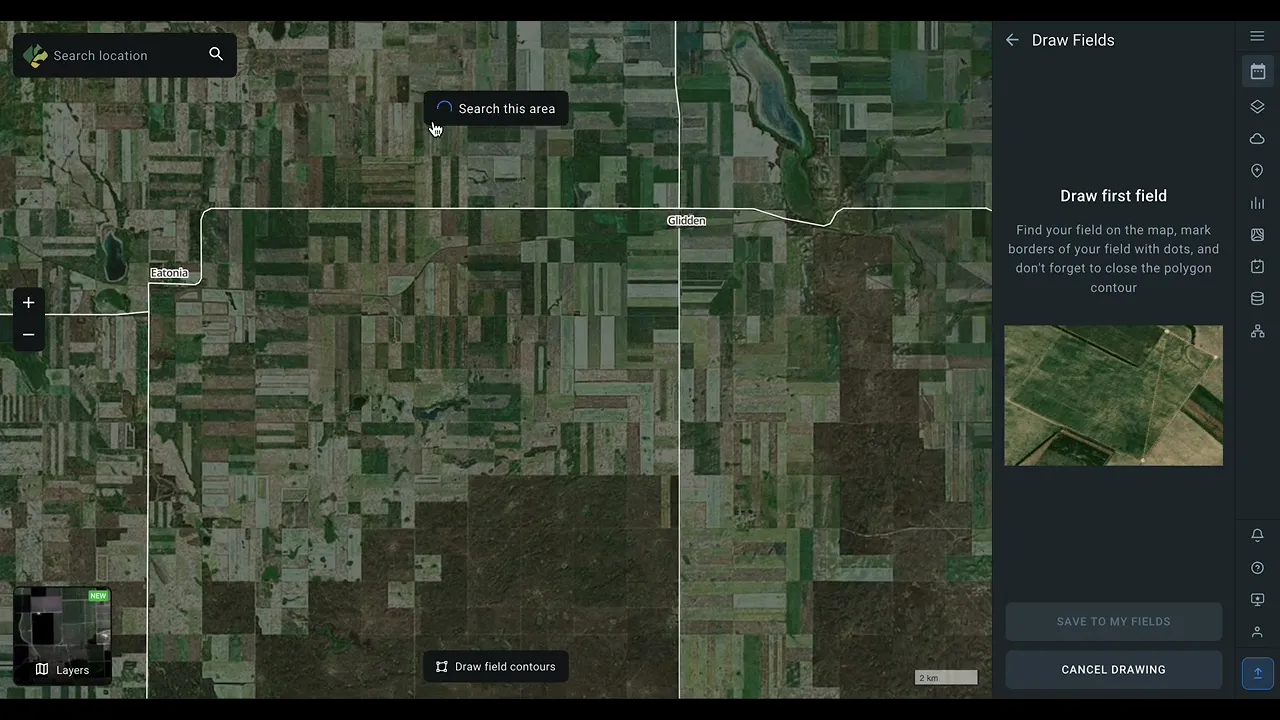
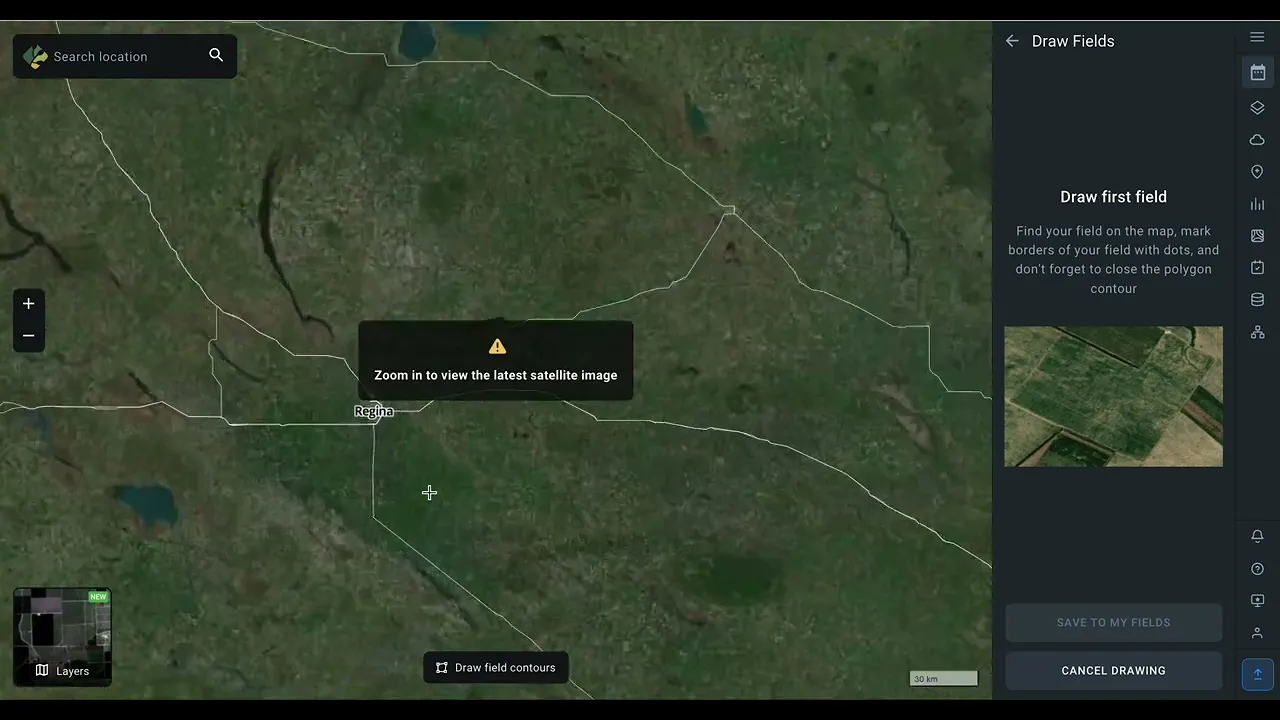
Sometimes the default map used in EOSDA Crop Monitoring may not reflect the current state of your fields.
If the field view differs from the actual situation on the ground, you can use the “Latest Image” layer, which allows you to see the most recent available satellite images for this area, which are weeks old, not years.
- Use the layer switcher to switch to the “Latest Image” layer.
- Zoom in to a 2 km scale.
- Click the “Search this area” button to automatically search and display the latest available image for the visible area.
You can also choose other images to display if they are available for this area.
Select any other available image by clicking on the image date if the previous image did not suit you.
If there are no available images for the viewed area, you can move the visible area of the map to another location and search for images, or switch back to the default map.