Solutions
-
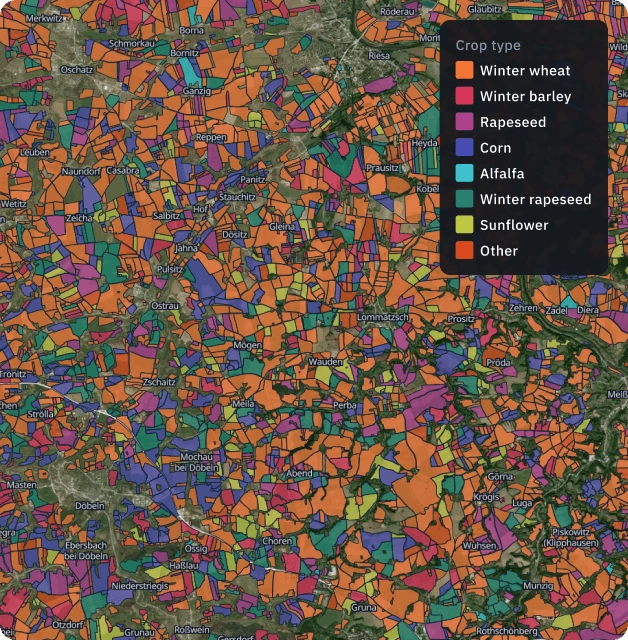
Crop classification
Identify crop types and field boundaries with high-accuracy ML models. Get reliable maps to optimize logistics and field management.

-
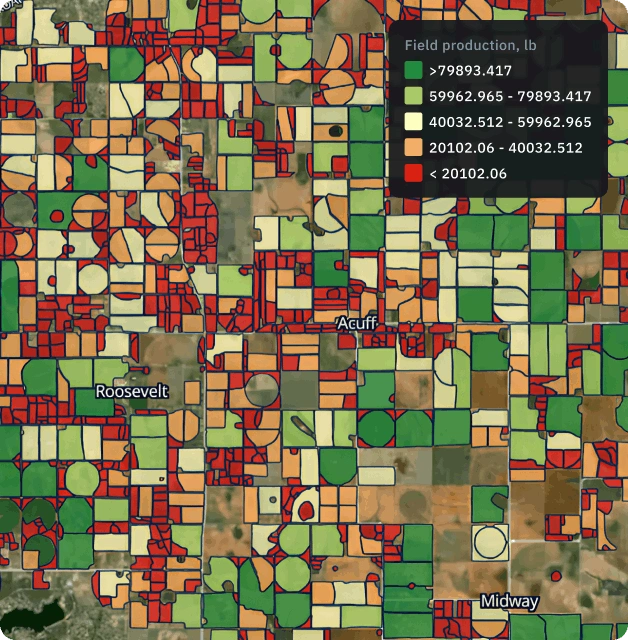
Yield prediction
Forecast crop production levels with confidence. We combine biophysical and ML models to deliver regional yield estimates across any season.
-
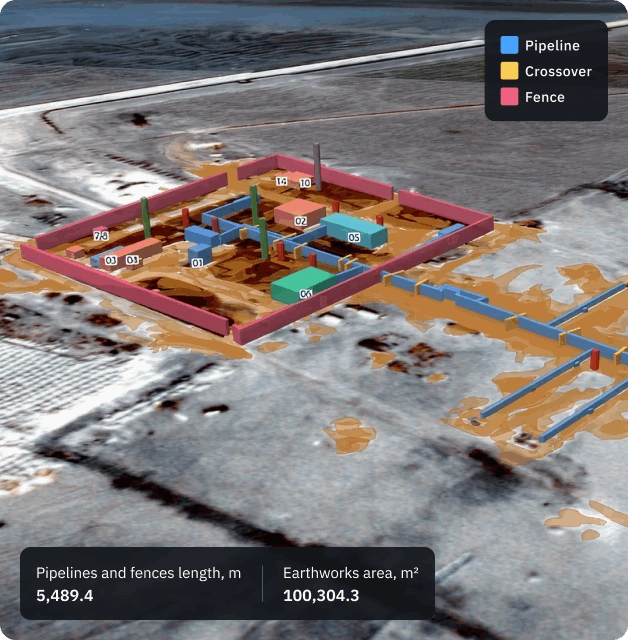
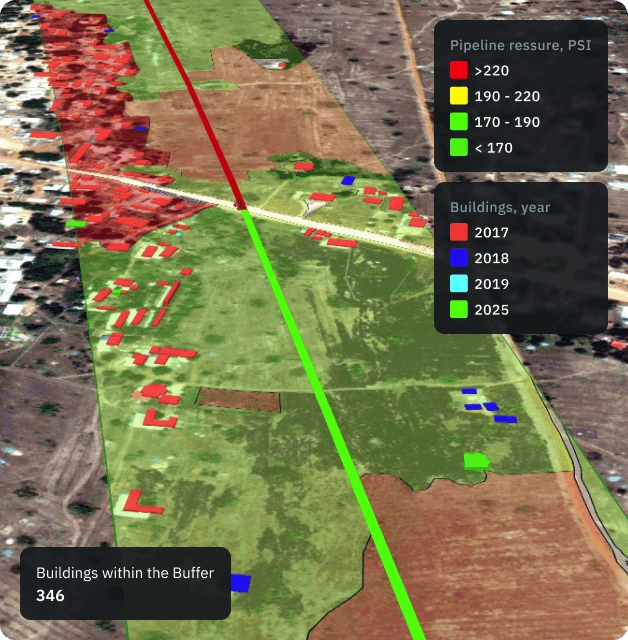
Infrastructure monitoring
Keep an eye on infrastructure assets. Monitor pipelines, dams, mines, and remote equipment activity for safer and efficent operations.
-
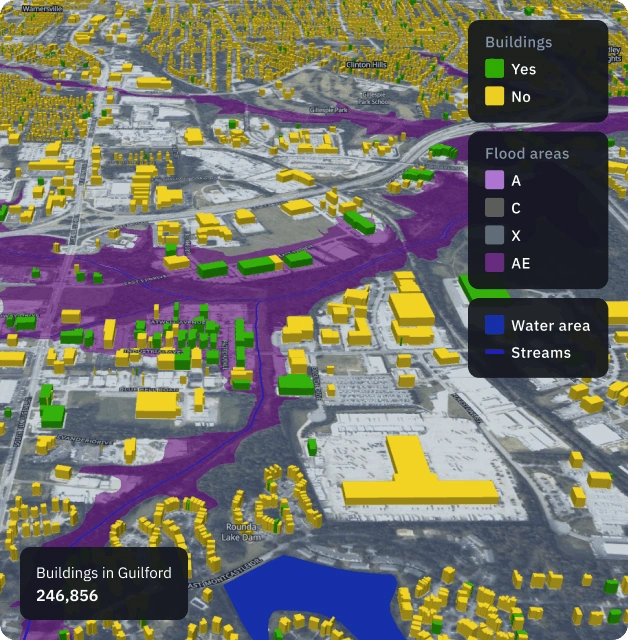
Damage mapping
Speed up recovery and prevent losses with rapid disaster analysis and contamination detection. Perfect for verifying insurance claims and coordinating emergency response.
-
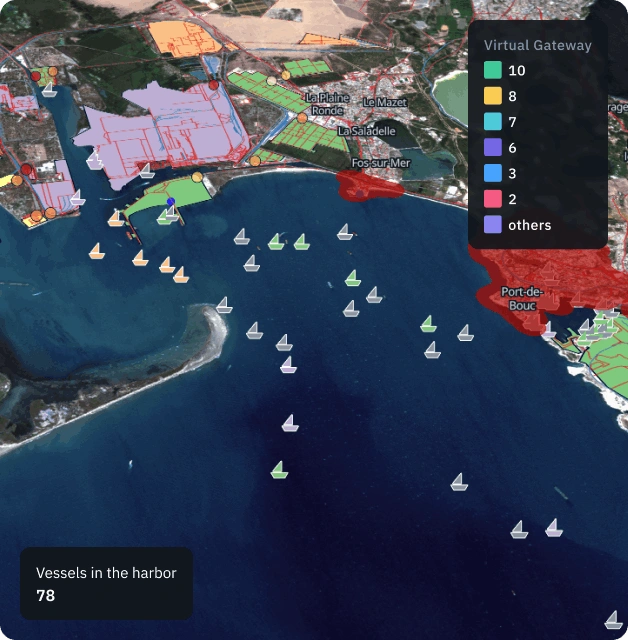
Maritime surveillance
Track vessel movement and port activity from space. Get the insights you need for security, compliance, and global logistics.
-
Border security
Secure border zones by identifying new trails, unusual activity, and terrain changes to help patrols prioritize their response.
-
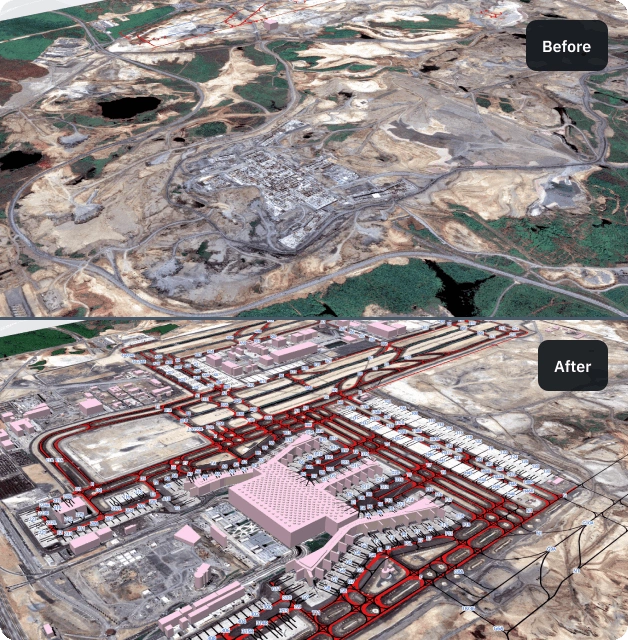
Change detection
Spot meaningful shifts on the ground using clear before and after satellite imagery by EOSDA. Receive alerts for new land use changes for faster investigation.
-
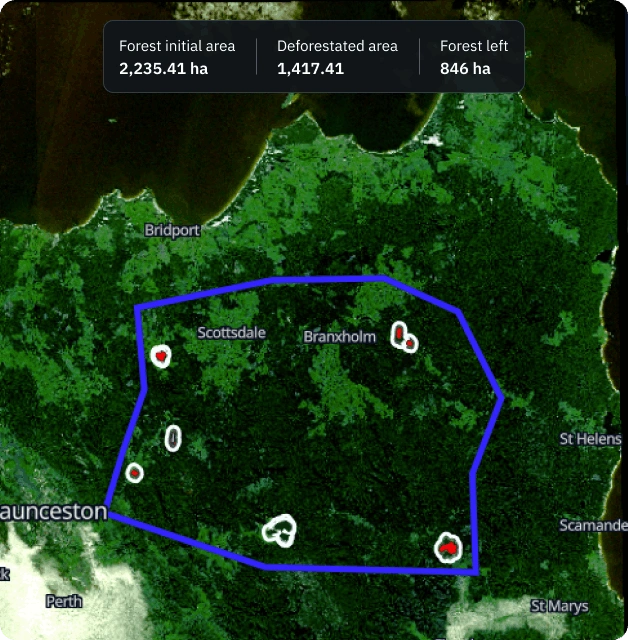
Deforestation detection
Protect natural resources with canopy-loss alerts. Track forest health and illegal clearing to support restoration and reporting.