Damage mapping
Get rapid, evidence-backed damage insights from satellite imagery to prioritize response, validate impact, and speed up recovery decisions.
How a damage mapping by EOS RayVision supports your strategic goals
Emergency response
Core benefit:
Quickly map affected zones to send rescue teams and resources where needed most.
Impact assessment
Core benefit:
Accurately quantify the extent and impact of the damage to plan next steps.
Recovery planning
Core benefit:
Focus efforts on the most critical sites and track restoration as it progresses.
Stakeholder reports
Core benefit:
Provide consistent evidence for governments, donors, insurers, and more.
Damage mapping data delivered in formats you need

Original data layers
Receive GEOJSON / KML / SHP datasets and upload them wherever you want.

Decision-ready PDF report
Actionable report summarizing key findings for rapid response and easy sharing.

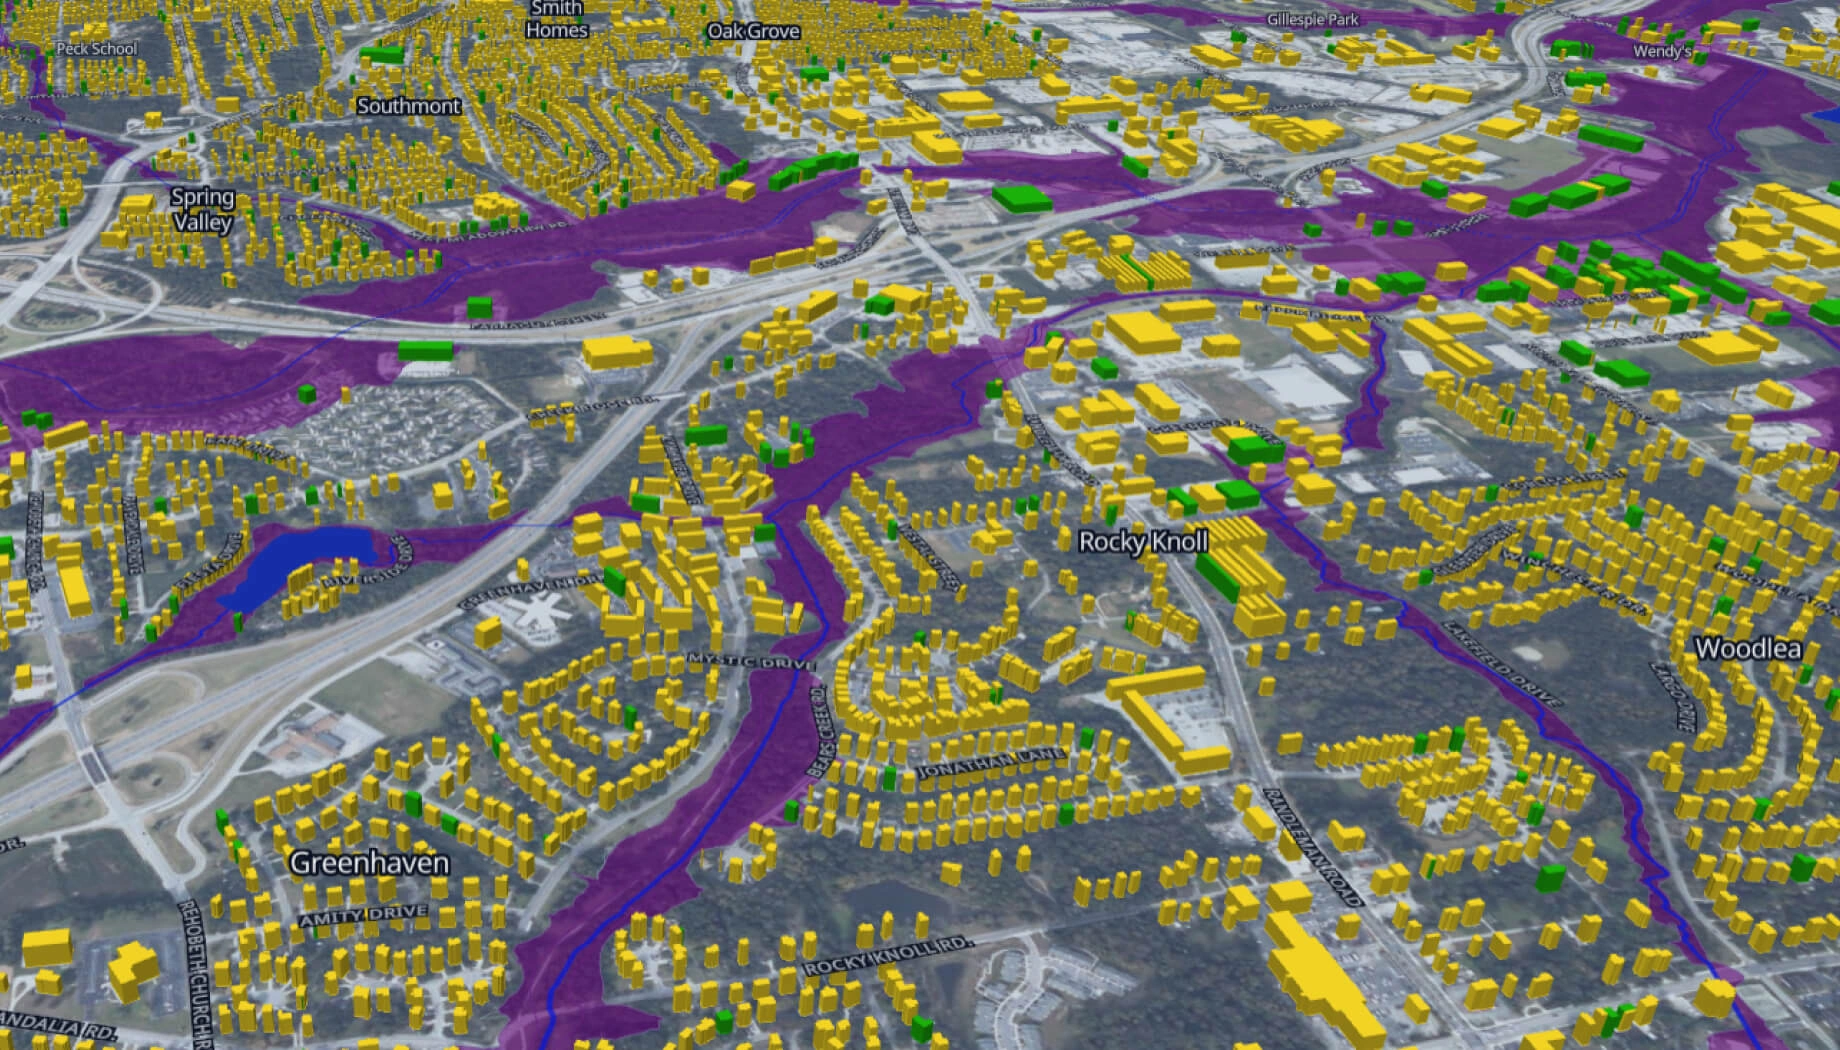
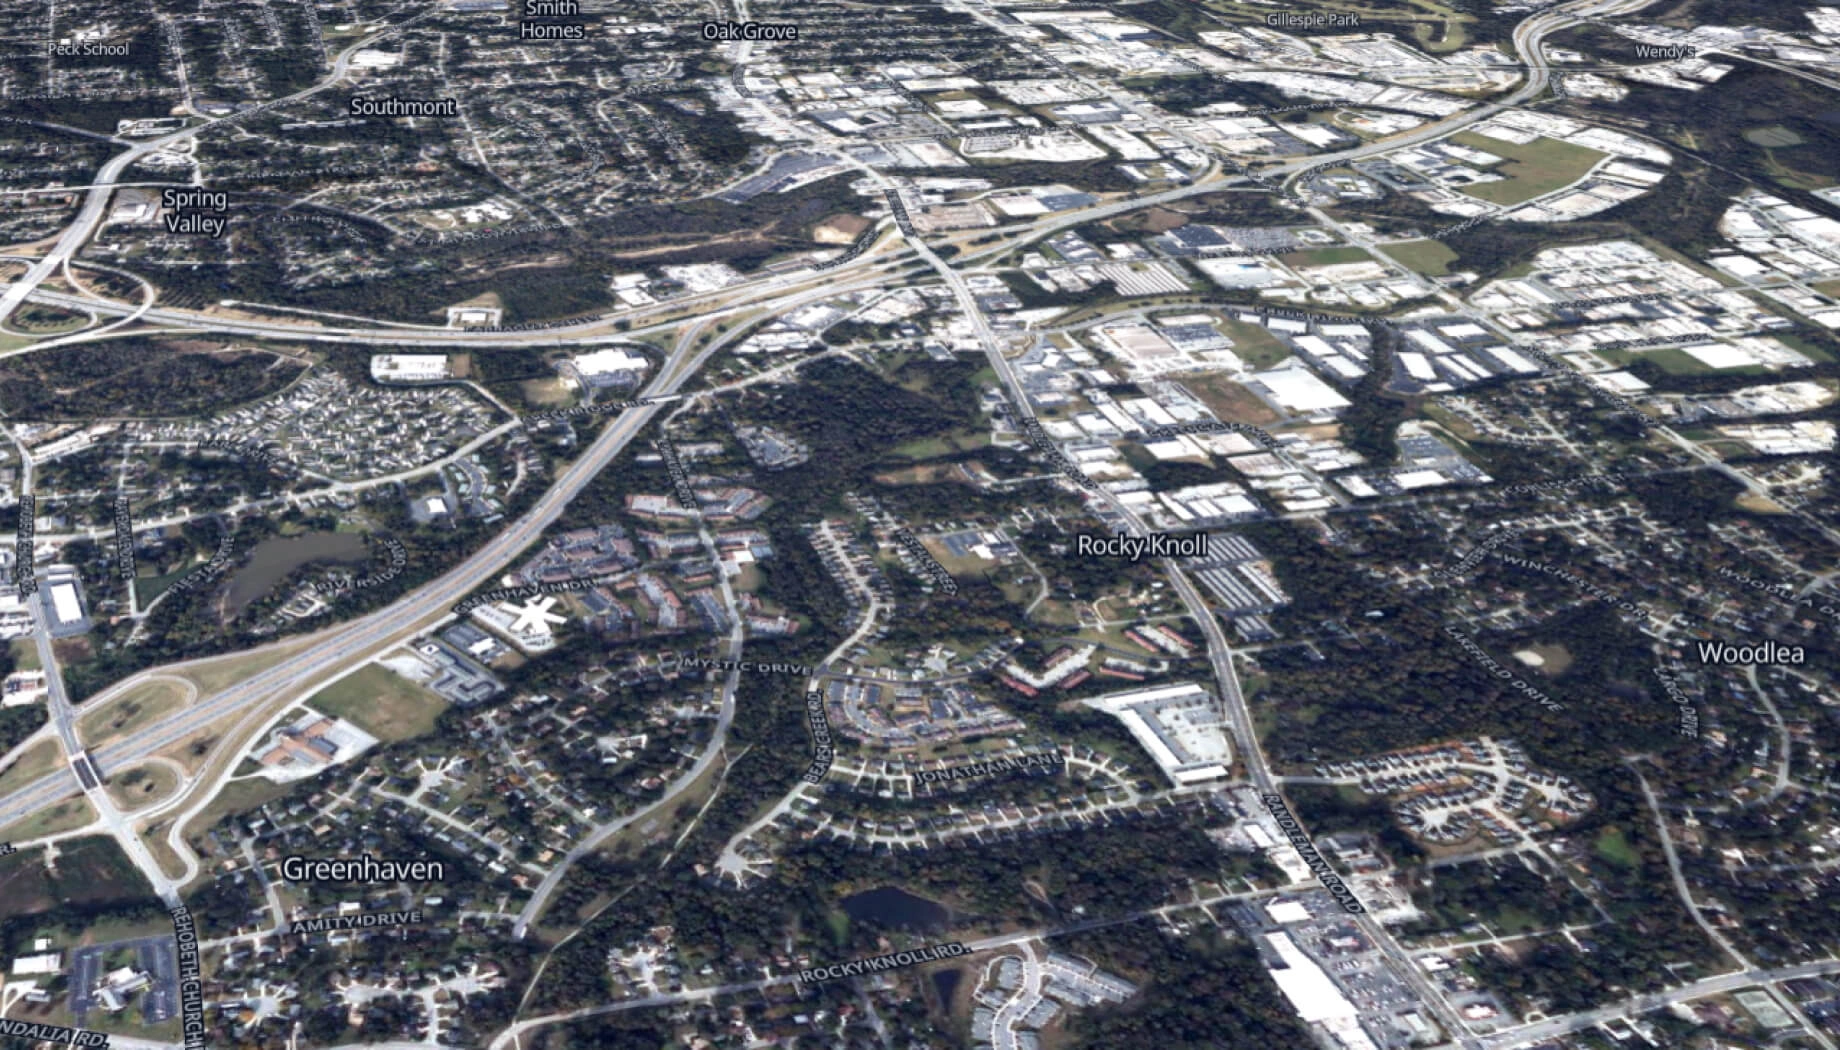
Interactive smart map
Cloud-based interactive map with 3D view for clear visualization and spatial analysis.
Typical project stages
Defining AOI, requirements, and KPIs
Selecting optimal imagery (optical, SAR, or hybrid)
Running baseline mapping and ML change detection
Validating, enriching, and prioritizing insights
Delivering data layers, a report, and a smart map on schedule
Featured case study

Flooding area and damage assessment in Ukraine
What sets the EOS RayVision approach apart
Intelligence, not raw data
Get ready-to-use insights, not just raw layers, to make decisions on the fly.
Multi-sensor monitoring
Never miss critical changes thanks to smart optical and SAR coverage of 20+ constellations.
Global scale, fast rollout
Deploy quickly across regions to standardize damage mapping and save time.
Flexible delivery and visualization
Access data in the way that fits your workflow: GIS layers, PDF reports, or 3D interactive maps.
Reusable ML/AI models
Get consistent, accurate detection across assets through proven ML/AI models.
End-to-end expert implementation
In-house science and GIS teams handle the full process for reliable results every time.
FAQ
What types of events can you map?
We can map damage after industrial incidents and natural disasters (including floods, storms, wildfires, explosions, landslides) using indicators tailored to each event type.
What assets can be assessed?
Our solution allows to assess buildings, roads, bridges, utilities, crops, industrial facilities, ports, warehouses, and critical infrastructure, along with impacts on surrounding land and communities.
How quickly can I get the first results?
We can deliver the first outputs within 24 hours after tasking for urgent cases, depending on imagery availability and AOI size.
Can your solution support claims or compensation workflows?
Sure, we can package damage evidence for claims review, filtered by location, severity, and confidence level, and aligned to claim IDs or site lists.
How accurate are the results?
Our damage mapping results are highly accurate. We ensure accuracy by combining multi-temporal evidence, cross-sensor checks, automated QA rules, and expert review for critical findings to reduce noise and false alarms.
How do you handle clouds, smoke, or poor visibility?
We overcome visibility limitations and ensure monitoring continuity by switching to SAR or hybrid acquisition methods.
Can you track the recovery process besides the initial damage?
Yes, we run repeat assessments to track stabilization, cleanup, rebuilding progress, and remaining hotspots.