Climate risk analysis
Quantify climate-driven yield and production risks, turning weather and satellite signals into actionable insights for planning and finance.
How EOS RayVision enhances the precision of climate risk analysis
Yield risk forecasting
Core benefit:
Estimate yield risks and volatility from climate stress for procurement and planning.
Drought and heat impact monitoring
Core benefit:
Track crop stress signals and anomaly patterns early, before losses show up in reports.
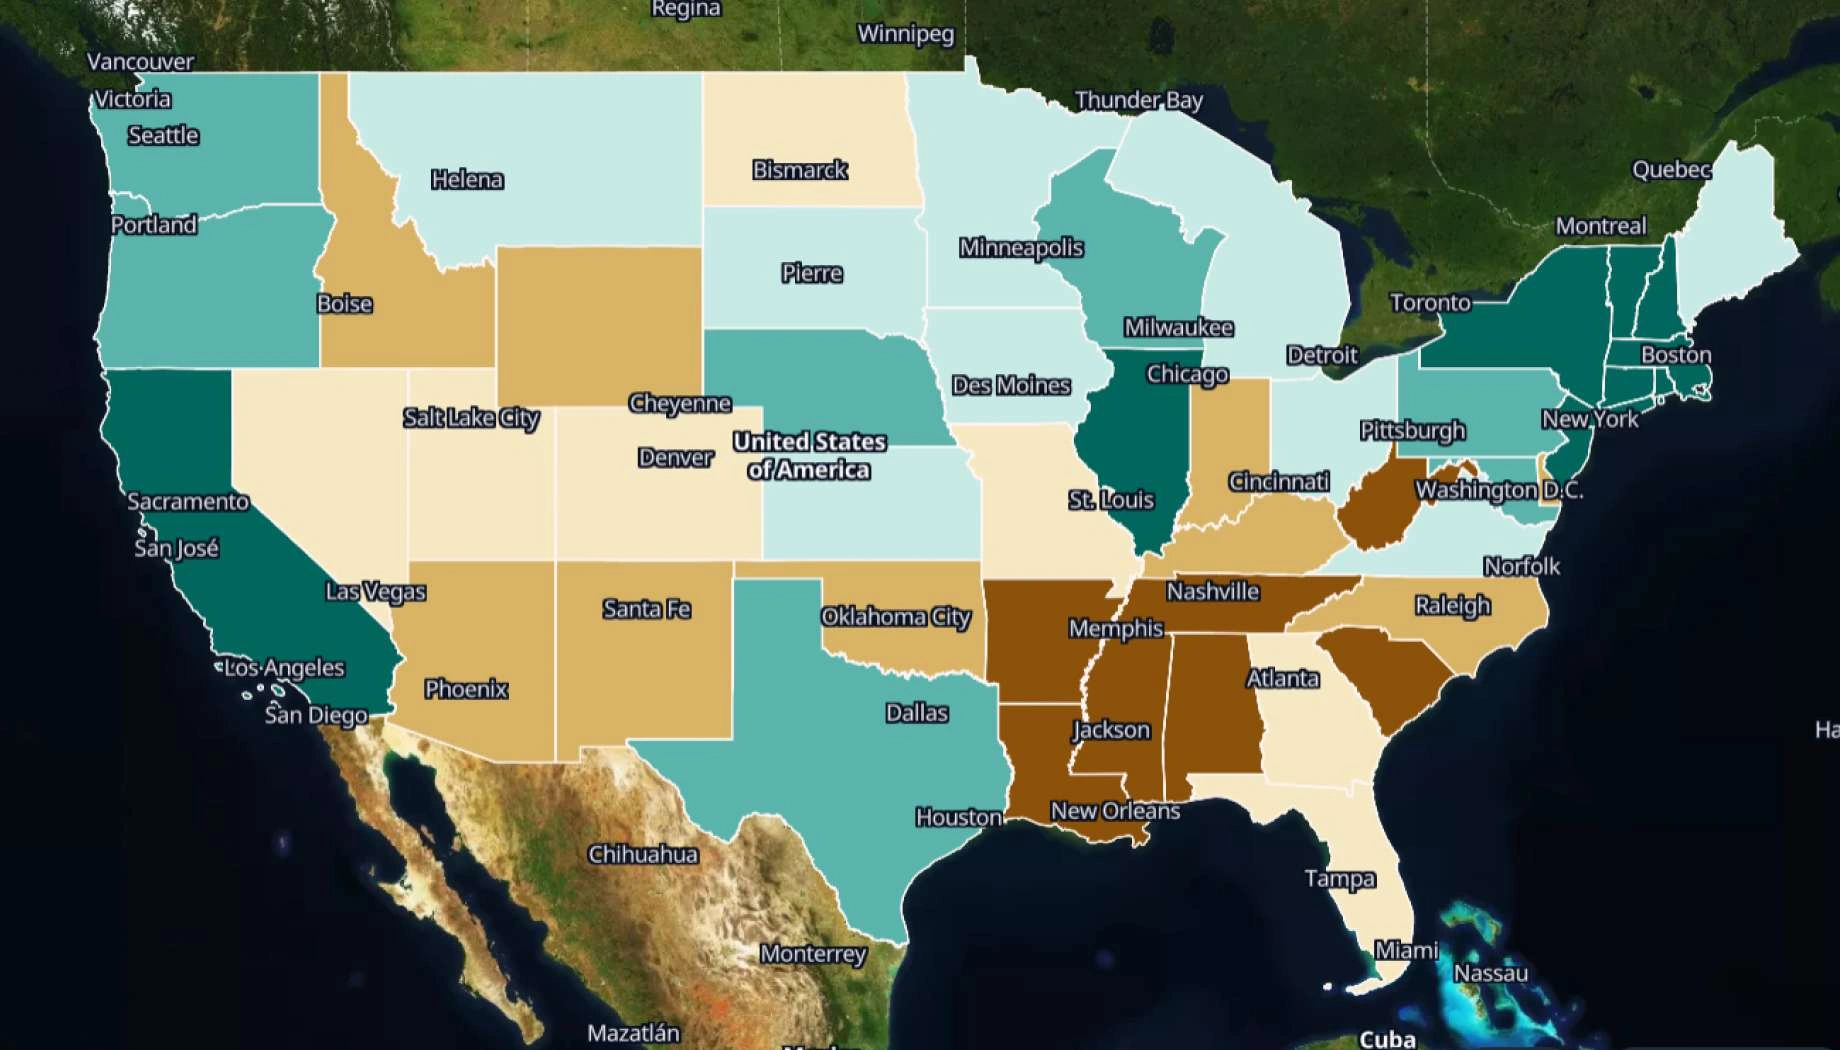
Regional risk screening
Core benefit:
Compare risk across regions and seasons to diversify sourcing, prioritize support actions.
Scenario-based decision support
Core benefit:
Test dry season, heatwaves, delayed rains scenarios to plan budgets and inputs.
Outputs by EOS RayVision for assessing climate risks

Original data layers
Details of that data format.

Decision-ready PDF report
Insights and clear conclusions, packaged for fast decisions and easy sharing.

Interactive smart map
Cloud-based interactive smart maps with 3D visualization.
Typical project stages
Defining AOI, requirements, and KPIs
Selecting optimal imagery (optical, SAR, or hybrid)
Running baseline mapping and ML change detection
Validating, enriching, and prioritizing insights
Delivering data layers, a report, and a smart map on schedule
Why global leaders rely on EOS RayVision for climate risk assessment
Intelligence, not raw data
Decision-ready detections and evidence instead of raw layers.
Multi-sensor monitoring
Optimal optical/SAR mix for clouds, and revisit constraints. EOSSAT-1 and 20+ constellations.
Global scale, fast rollout
Deploy across countries and portfolios with consistent methodology.
Flexible delivery and visualization
Access data in the way: GIS layers, PDF reports, or 3D interactive maps.
Reusable ML/AI models
Get consistent, accurate detection across assets through proven ML/AI models.
End-to-end expert implementation
In-house science and GIS teams handle the full process for reliable results every time.
FAQ
What risks do you analyze for crops?
Drought, heat stress, rainfall anomalies, vegetation stress, season shifts, and yield volatility, depending on region and crop type.
Is this real-time monitoring or long-term climate analytics?
Both. In EOS RayVision, we combine near-season monitoring (current crop stress) with multi-year baselines to quantify changing risk patterns.
What crops does this work for?
EOS RayVision solution works for any crop with consistent seasonal signatures. Accuracy improves with clear phenology and reliable historical data for the region.
How do you ensure accuracy?
Model calibration on historical seasons, out-of-sample validation, QA checks for data quality, and continuous monitoring of forecast error.
Can this support procurement and commodity decisions?
Yes. Outputs of EOS RayVision are designed for decision use: risk levels, anomaly maps, regional comparisons, and season-to-date indicators.
What do you need from us to start?
Target crops, regions/AOIs, season calendars, and the decision KPIs you care about (yield risk, supply risk, timing, thresholds).