Win more farm clients with satellite-backed field analysis
Show up to every meeting with NDVI history, crop-health maps, and risk reports. Build professional analytics in minutes, right in your browser
Works for any crop, anywhere
You're only as convincing as the data you bring

Close deals with field-specific evidence
Replace subjective opinions with objective, data-backed insights for each field

Bypass the expensive, complex tech stack
Get professional-grade data without wrestling with slow GIS software or expensive drones

Scale your consulting, not manual labor
Automate data collection across dozens of client farms and focus on delivering high-value strategy
From field data to a pitch-ready report — in one LandViewer session
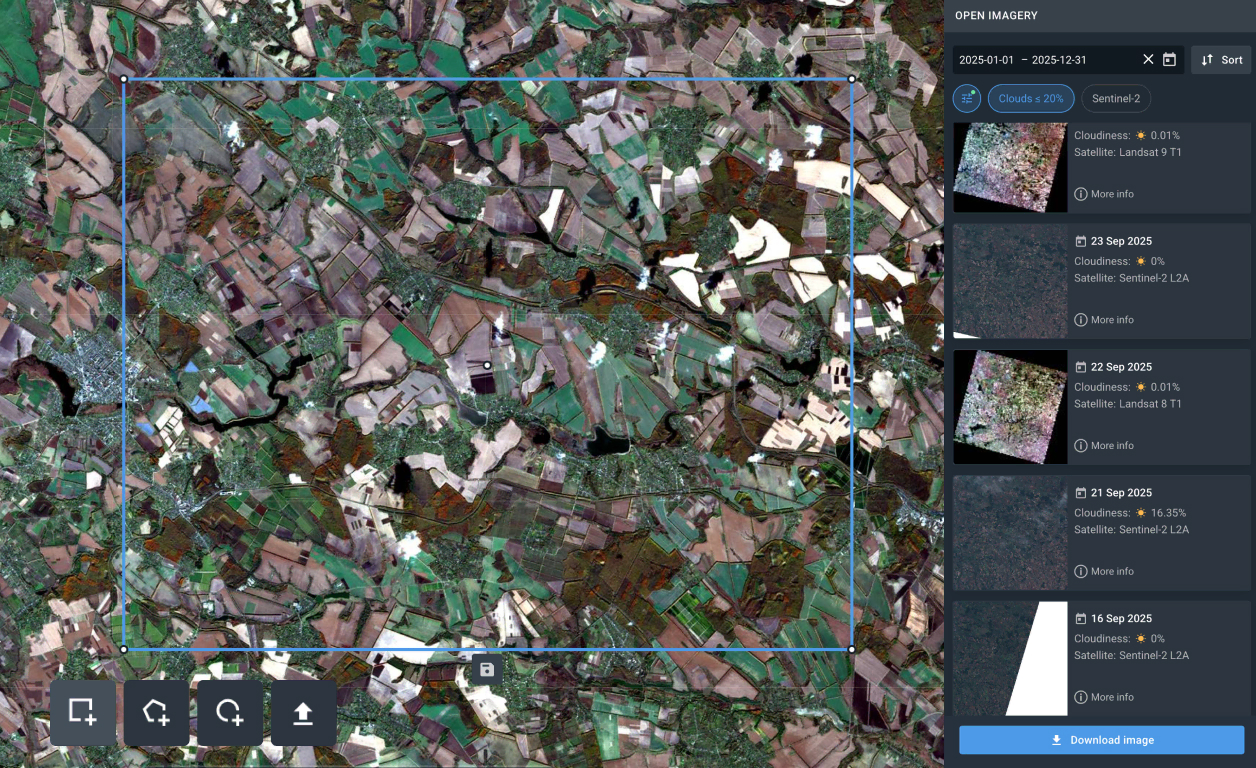
Draw or upload the field
Add your client's field boundaries or a whole portfolio of farms
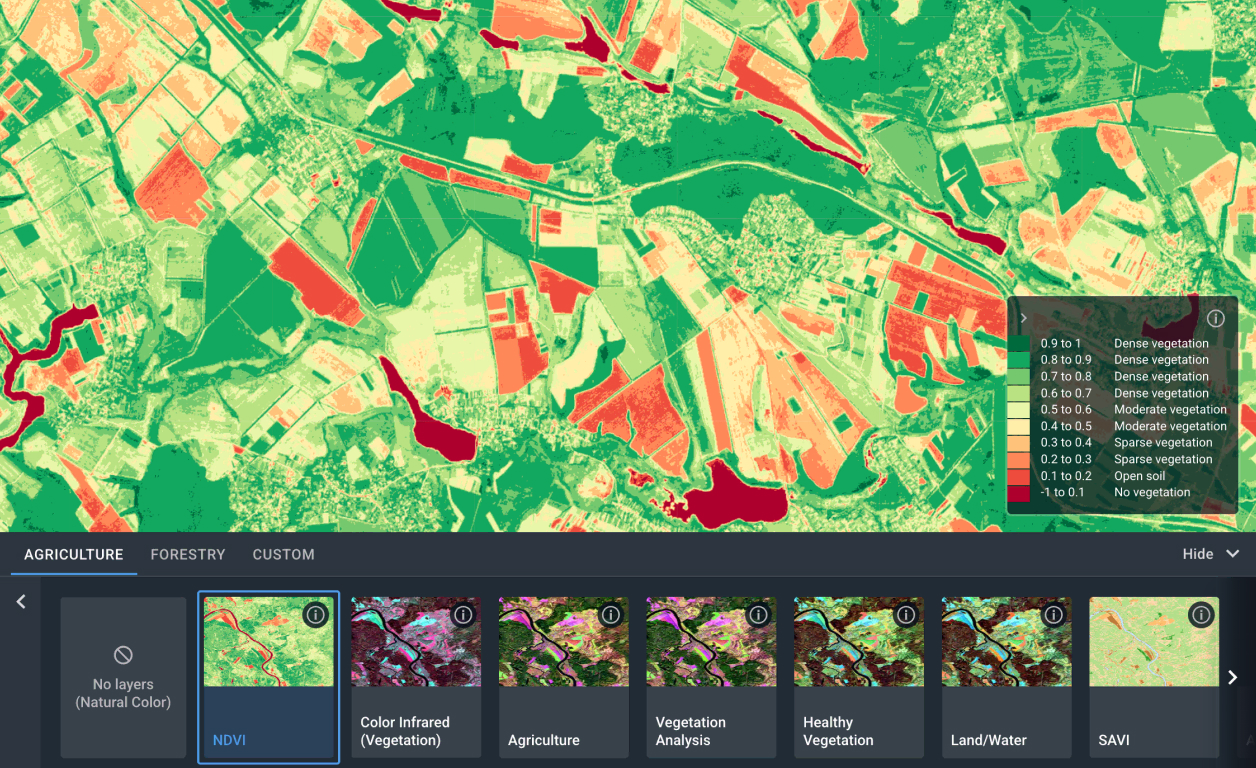
Apply NDVI and analytics in a few clicks
Get instant crop-health indices, historical charts, and change detection without tweaking complex formulas
Export and present
Download GeoTIFFs and time-series visuals that make your report undeniably authoritative
Key features for ag consulting
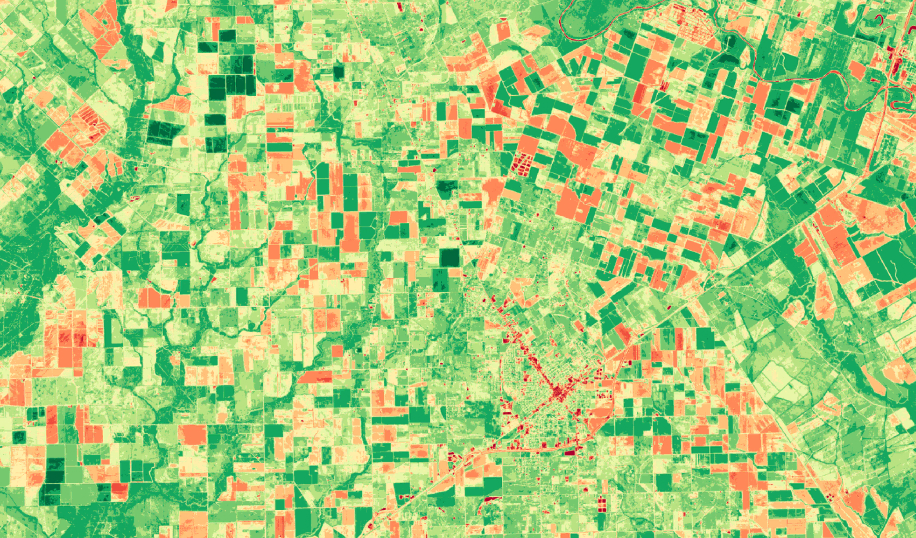
NDVI mapping across large areas
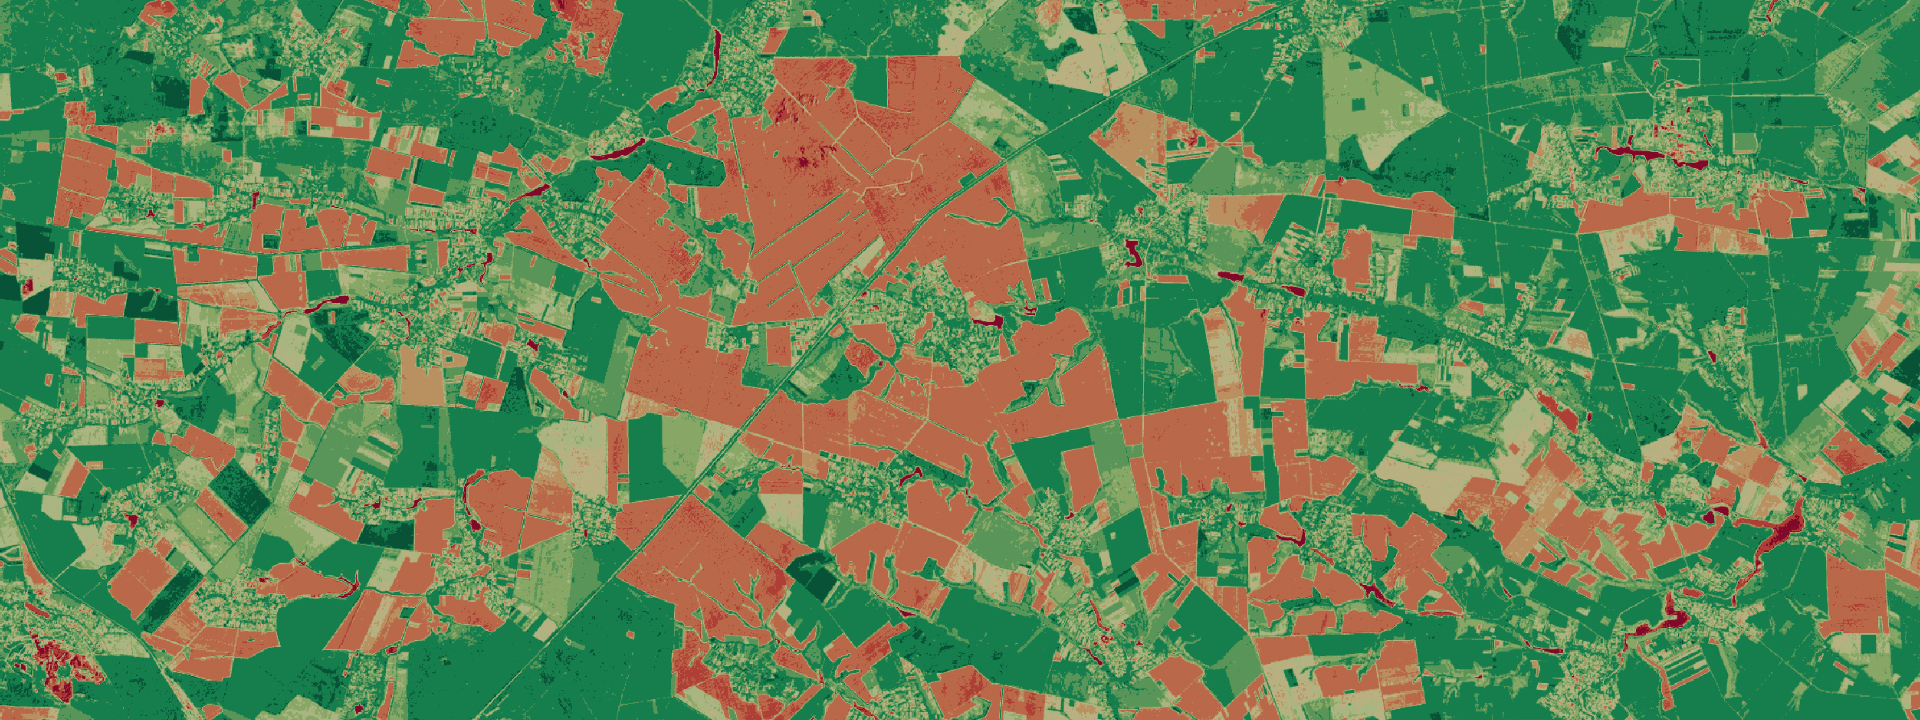
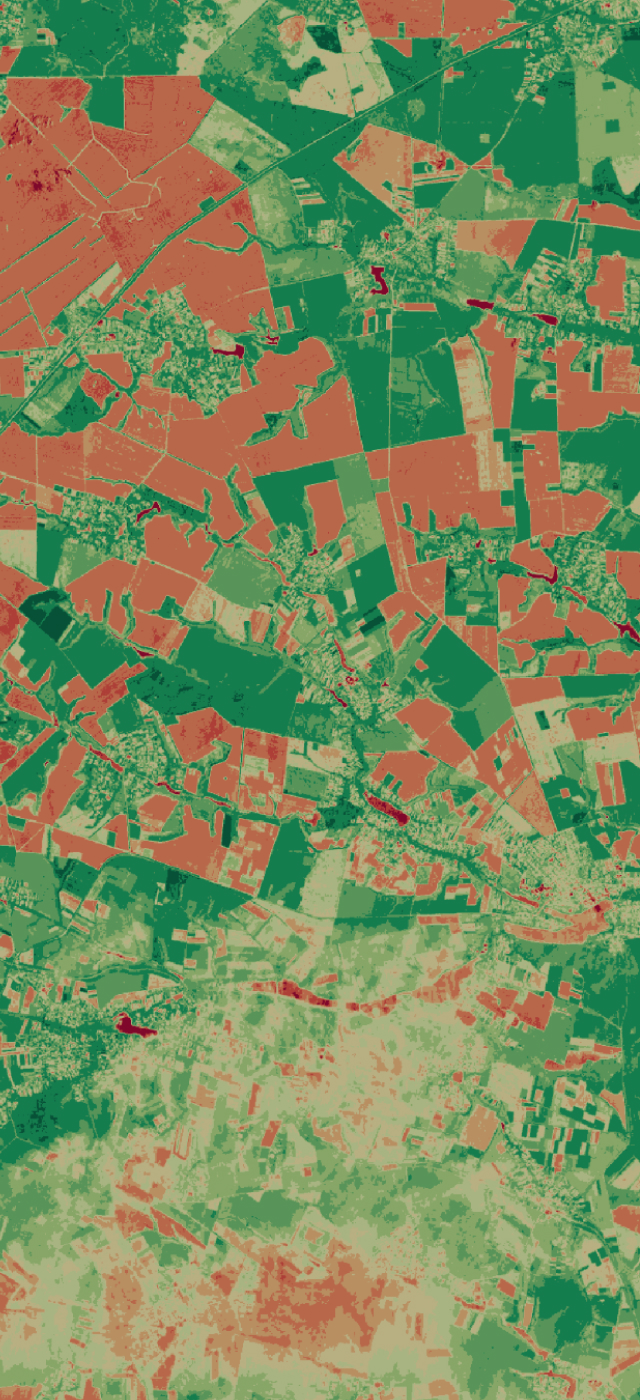
Instantly scan entire agricultural zones to pinpoint underperforming fields. Bring undeniable visual proof to your first meeting to build trust and win over prospects.
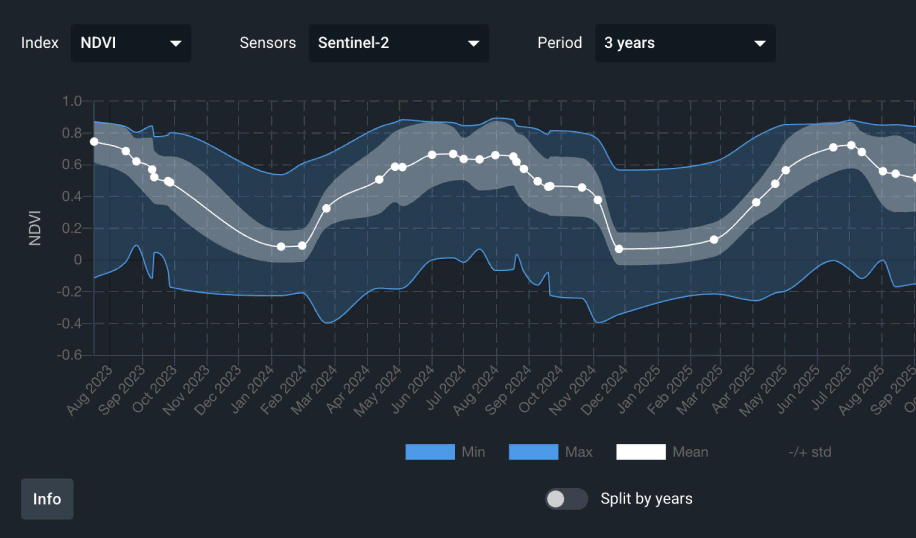
Historical crop dynamics and productivity zoning
Provide clients with deep insights into their land's potential by evaluating long-term crop trends spanning decades. Generate detailed multi-year productivity maps to accurately predict field yields and advise farmers on optimal land use.
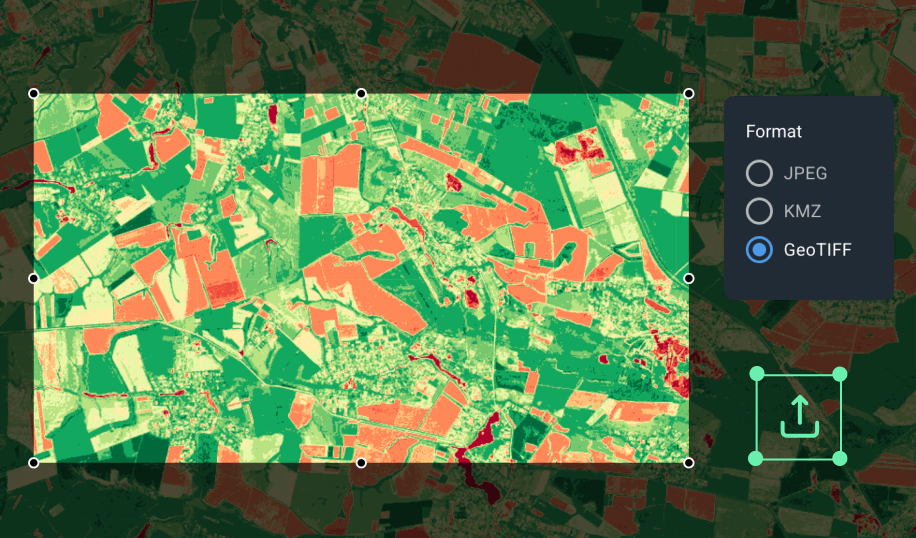
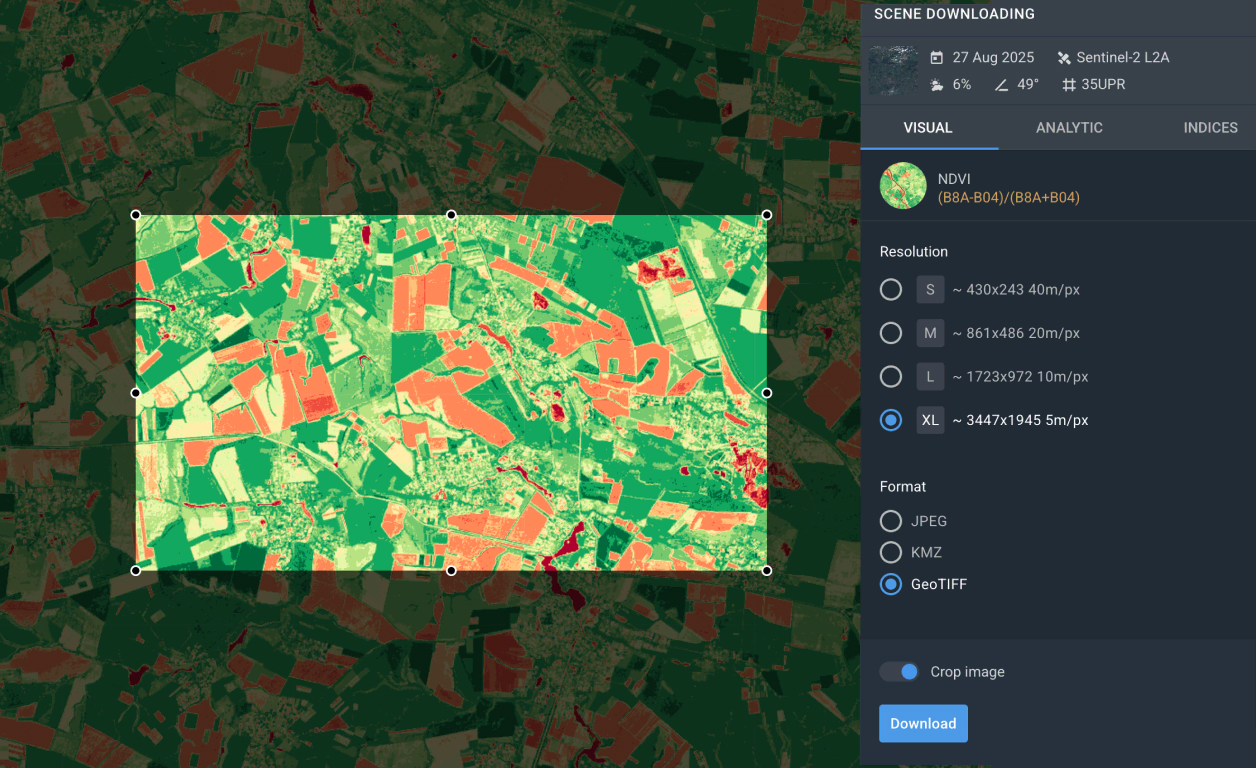
Automated bulk data export
Save hours of manual administrative work. Mass-download satellite imagery and vegetation data for multiple fields or entire farm portfolios at once, eliminating the need to process files one by one.
How LandViewer elevates your consulting
Stand out with insights that wow your clients
NDVI history or crop stress maps of each field — the "how did you know that?" moment that wins the deal.
Manage your entire portfolio proactively
Track every client's fields on a regular schedule. Flag problem areas and offer solutions before the farmer even notices signs of stress.
Turn crop damage into clear deliverables
Assess flood and drought impact fast. Generate data-backed reports for insurance, tax relief, and emergency farm management.
Analyze decades of history, any crop, anywhere
Pull years of satellite data to reveal long-term trends instantly. No heavy hardware required — just your browser.
Trusted by ag professionals worldwide





FAQ
How often can I get updated satellite data for a specific field?
LandViewer updates satellite imagery every 2 to 5 days. The platform integrates near-real-time data from Sentinel-2 and Landsat satellites, which allows agricultural consultants to track crop-health dynamics, monitor NDVI indices, and detect field anomalies early across any territory worldwide.
Do I need a GIS background or special training to use the platform?
No, LandViewer requires zero GIS background, specialized software, or coding skills. It is a 100% browser-based tool built for easy day-to-day agricultural analysis, where each agro consultant can generate advanced vegetation indices and productivity zones in just a few clicks.
Can I automatically upload existing client field boundaries?
Yes, LandViewer supports automatic batch uploading for multiple field boundaries at once. You can import an entire farm portfolio simultaneously using standard geospatial formats like KML, KMZ, and Shapefiles (SHP), completely eliminating manual drawing.
Does LandViewer suit all crop types and regions?
Yes, LandViewer provides global satellite coverage for all types of agricultural crops. Agro consultants use the platform to analyze multi-year historical dynamics for row crops, grains, orchards, vineyards, and vegetables across any territory worldwide.
How does LandViewer help with assessing weather or crop damage?
LandViewer compares fresh satellite images with past field history to calculate exact crop damage. You can instantly see how a flood, drought, or storm affected the land and download data to back up insurance claims, tax relief, and farm management operations.
How does LandViewer handle cloud cover to simplify the client's field analysis?
LandViewer includes a built-in cloud cover filter that lets you instantly exclude cloudy scenes from your search. By setting your preferred cloudiness threshold, you can easily surface cloud-free dates for your client's field analysis. This ensures you can track reliable index trends over time and accurately advise your clients, even during bad weather seasons.
Is high-resolution imagery available for small fields or high-value crops like orchards?
Yes, LandViewer allows you to preview and purchase high-resolution commercial satellite imagery directly within the platform. While standard 10-m imagery works for large fields, high resolution gives you sub-meter precision (up to 30 cm per pixel) for analyzing vineyards, orchards, and small plots.