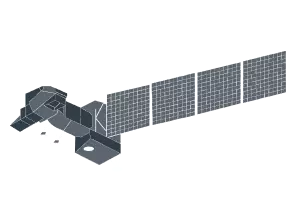
Landsat 9 satellite imagery: Easy access and advanced analysis
Access wide-swath, medium-resolution, and improved thermal multispectral Landsat 9 data on the EOSDA LandViewer platform:
-
Spatial resolution
15 m (panchromatic), 30 m (multispectral), 100 m (thermal)
-
Scene size
185 × 180 km
-
Revisit time
Every 16 days (8 days when combined with Landsat 8)
-
Data archives
From 2021 to present
-
Spectral bands
11 bands, covering visible, NIR, SWIR, and thermal (OLI-2 + TIRS-2)
-
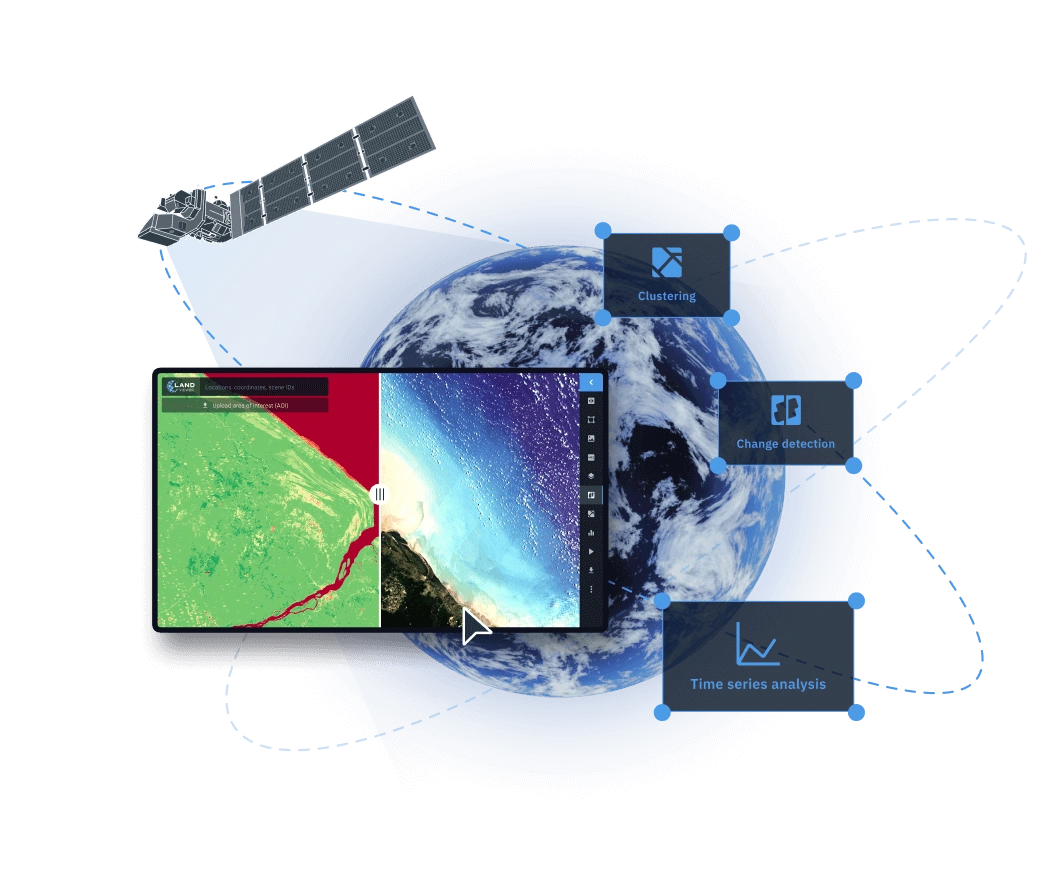
Analytical tools
Change detection, clusterization, time series analysis
How to access and download Landsat 9 Satellite Images on EOSDA LandViewer
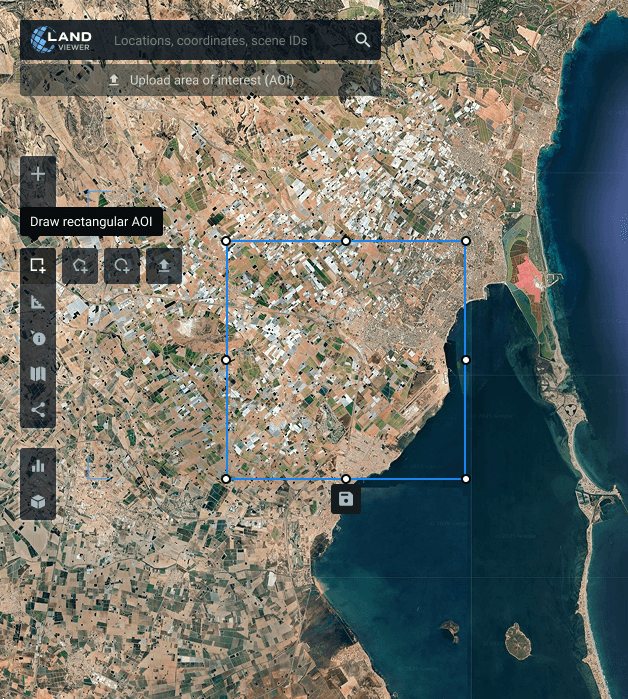
Define your AOI (area of interest)
Select your AOI by entering a location, outlining it directly on the map, or uploading a boundary file from your device for monitoring.
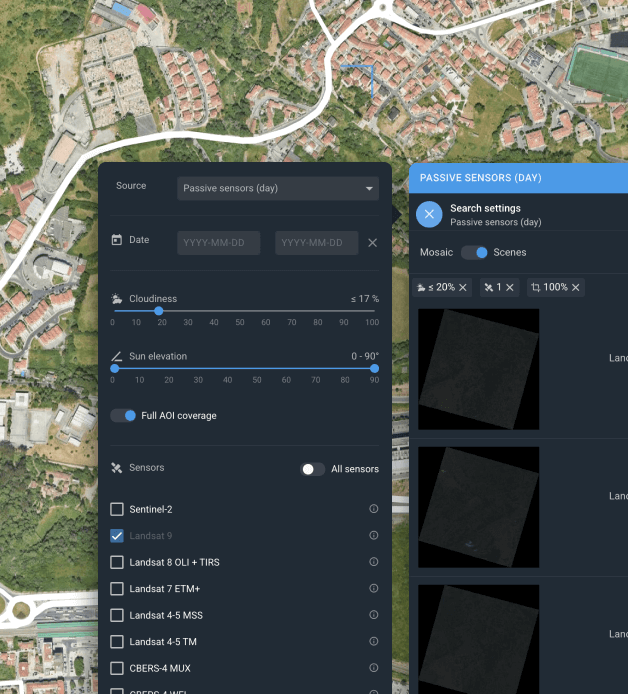
Apply filters to refine your search
Quickly select the most relevant Landsat 9 imagery by filtering results by date, cloud cover, sensor type, and AOI coverage.
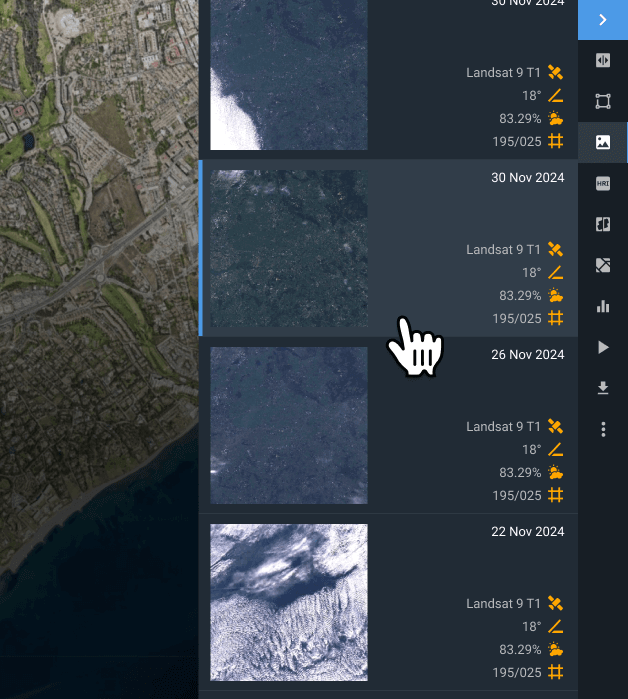
Select the most relevant scene
Explore the filtered scenes and select the one that best fits the needs of your project.
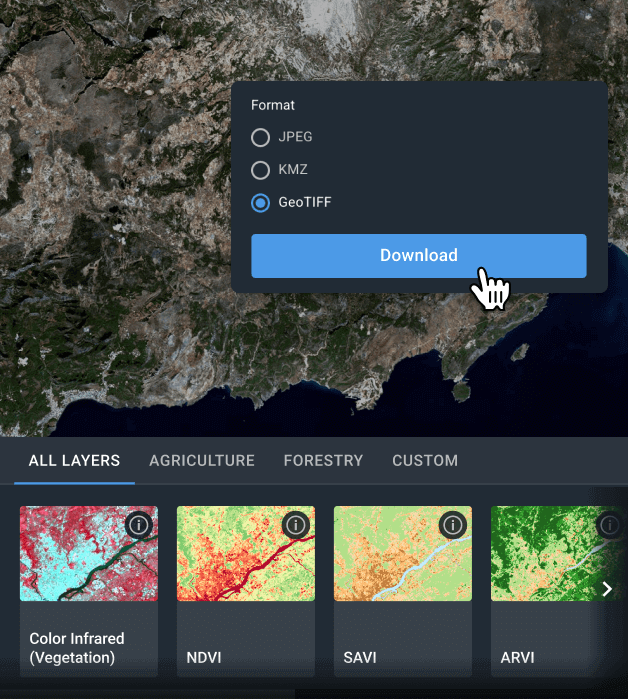
Download data or perform on-platform analytics
After selecting the desired Landsat 9 image, you can either download the data in GeoTIFF, KMZ, or JPEG format for use in external GIS tools like QGIS or ArcGIS, or analyze it right in EOSDA LandViewer using built-in tools, such as spectral indices, band combinations, time series, change detection, and clustering.
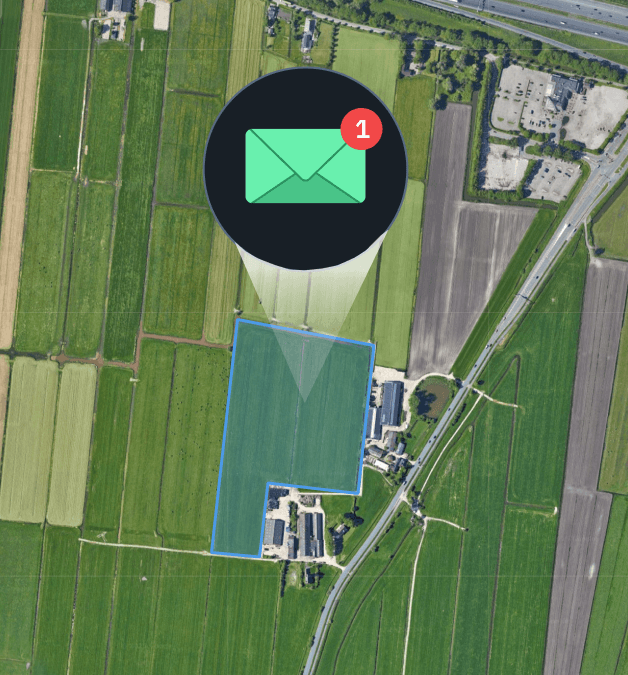
Set up notifications for new images
If the most recent Landsat 9 satellite imagery isn’t currently available, you can enable notifications to receive alerts when new data for your area is released.
Turn Landsat 9 images into valuable insights with EOSDA LandViewer
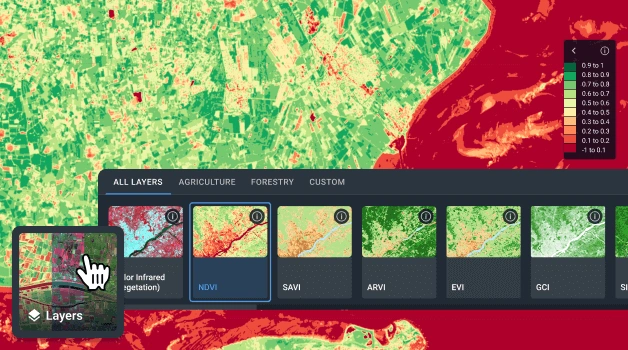
Indices and Band Combinations
EOSDA LandViewer simplifies satellite data analysis by offering immediate access to over 20 preconfigured indices and band combinations. These tools are designed to support detailed monitoring of vegetation, soil, and other environmental indicators. If standard options aren’t sufficient, you can define and apply your own custom indices to suit the specific requirements of your analysis.
Change Detection
Compare Landsat 9 satellite images captured at different times to reveal how landscapes change, whether through urban growth, environmental degradation, or the aftermath of natural disasters. This approach provides valuable insight for assessing risks, guiding development strategies, and supporting sustainable land use planning.
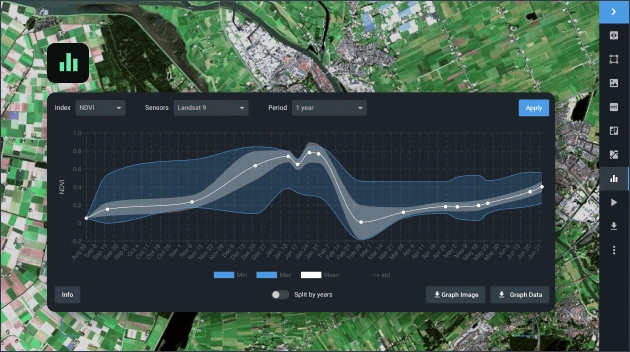
Time Series Analysis
Uncover long-term patterns and subtle changes in your area of interest by building time series graphs based on Landsat 9 satellite images. By applying relevant vegetation or land-use indices, you can track seasonal cycles, monitor ecological shifts, and measure the progression of urban development. This temporal analysis supports more informed decision-making in sectors ranging from agriculture to urban planning.
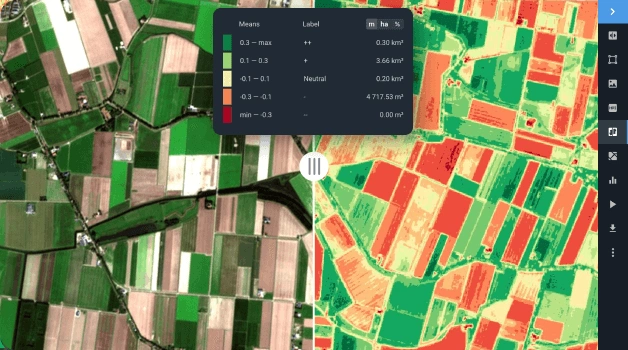
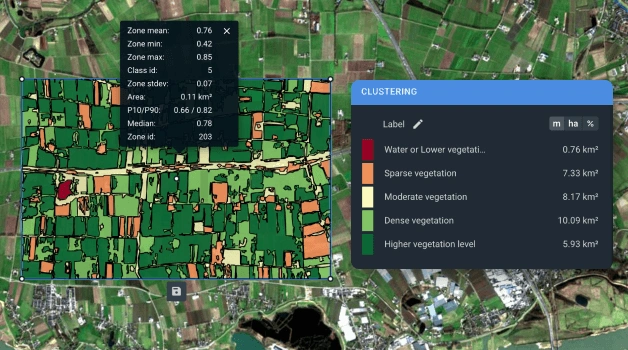
Clusterization
Transform raw satellite imagery into interpretable zones by applying clustering and vectorization techniques to raster data. This process creates two additional layers within your AOI, highlighting areas with similar index values. The resulting segmentation uncovers patterns in vegetation health, land cover dynamics, and water quality, providing valuable input for environmental monitoring, land management, and sector-specific decision-making.
Real-world applications of Landsat 9 imagery analytics


Rainfall impact on agricultural fields
- Tulare County, California, USA
- Band combination for agriculture
- Jun 6, 2022 - Jun 9, 2023


New city development
- East of Cairo, Egypt (29.98695°N 31.60848°E)
- False Color (Urban) band combination
- Nov 8, 2021 - Jun 9, 2025


Wildfires monitoring
- 47.32327°N 91.81389°W (Minessota)
- NBR index
- May 4, 2025 - May 29, 2025


Rockfall assessment
- Wiler (Lötschen), Switzerland
- Color Infrared band combination
- May 13, 2025 - May 29, 2025