Landsat 5 satellite imagery archive for historical analysis
-
Spatial resolution
30 m
-
Revisit time
–
-
Spectral bands
7 bands covering visible, NIR, SWIR, and thermal
-
Scene size
170 km x 185 km
-
Data archives
1984–2013
-
Analytical tools
Change detection, clustering, time series analysis
How to find and analyze Landsat 5 images on LandViewer
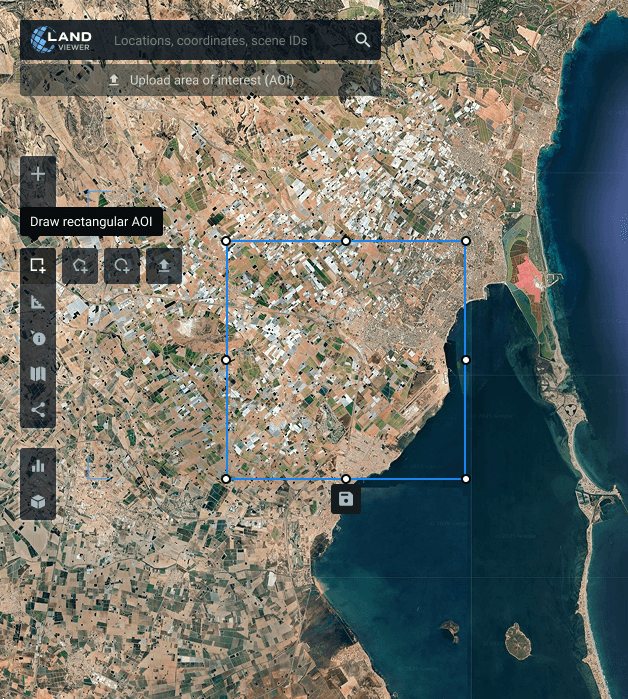
Outline your monitoring zone
Locate your area on the map, draw its boundaries manually, or import a predefined AOI (area of interest) to begin tracking changes.
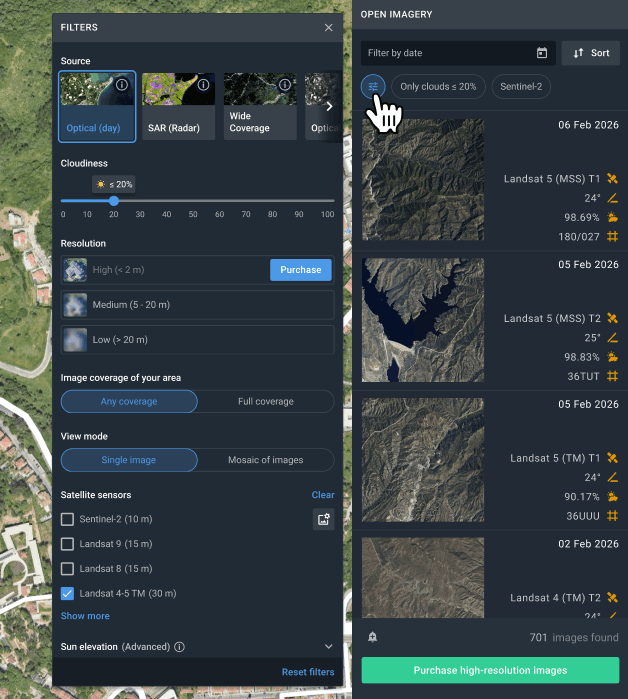
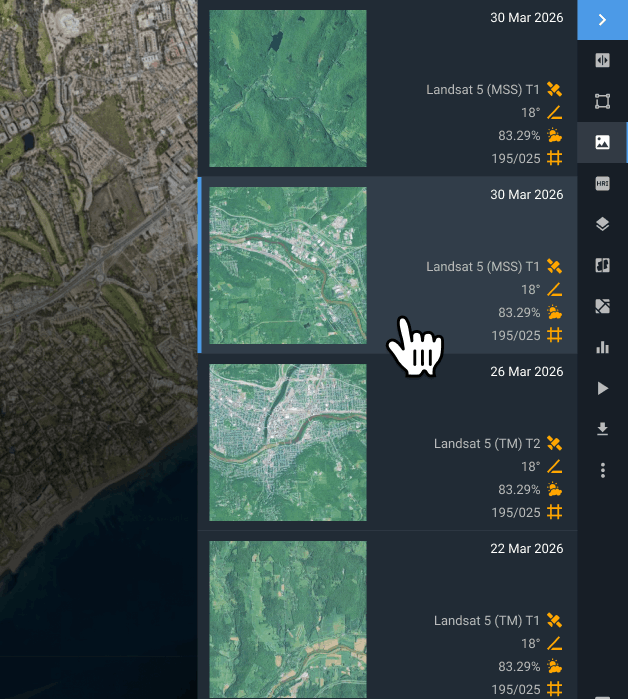
Filter imagery by key parameters
Sort Landsat 5 MSS imagery using cloud cover, acquisition date, sensor details, and area overlap to find the most relevant scenes faster.
Choose the imagery you need
Browse filtered scenes and choose the ones that best match your project needs.
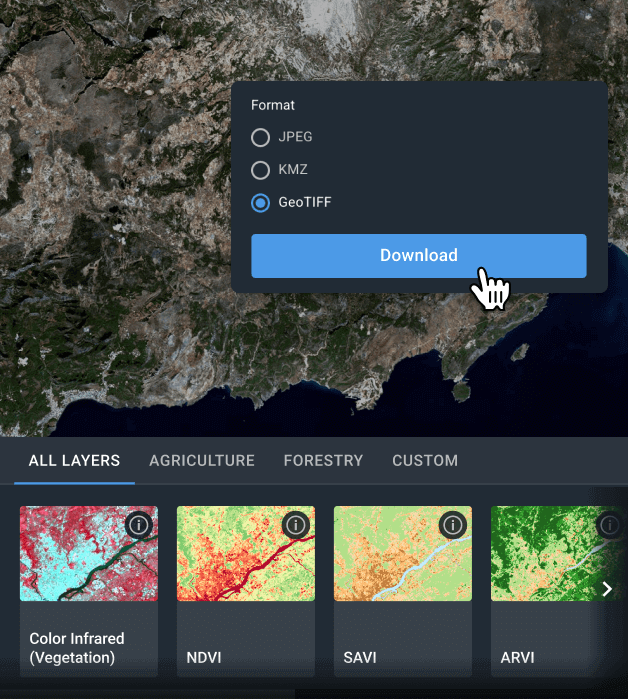
Export files or run analysis in the platform
Download chosen imagery in GeoTIFF, KMZ, or JPEG for third-party GIS processing, or analyze them directly within LandViewer using indices, band combinations, and advanced features like time series, change detection, and clustering.
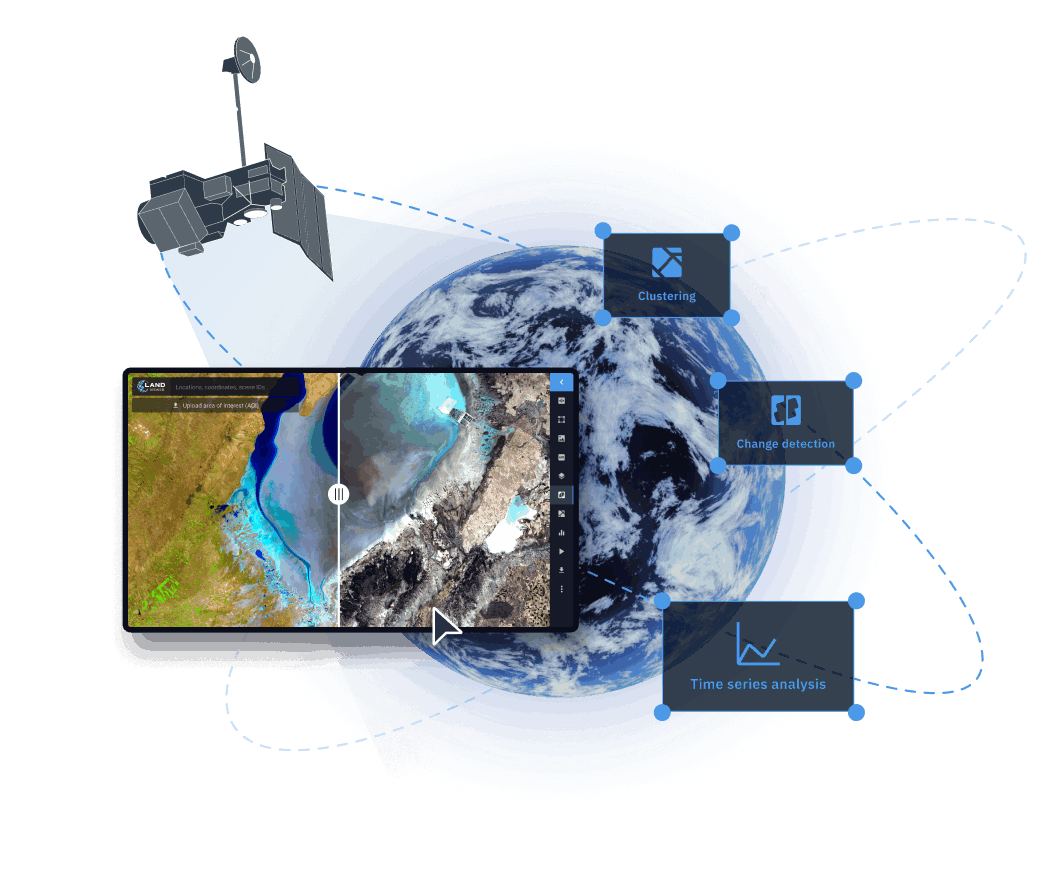
Make the most of Landsat 5 satellite imagery with LandViewer analytics
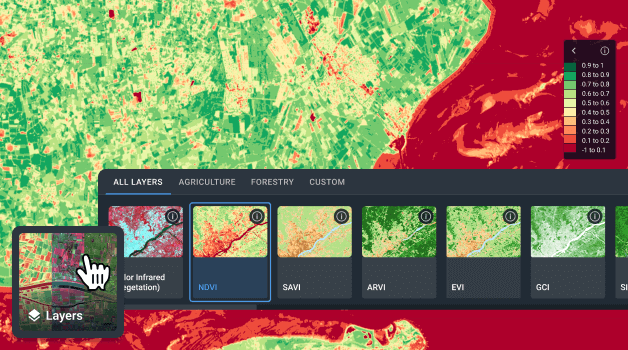
Indices and band combinations
Improve object and surface recognition by selecting optimal spectral bands for your specific task. With more than 20 built-in indices and band combinations, LandViewer enables in-depth evaluation of plant vitality, soil conditions, and ecological disturbances. Custom indices can also be configured when standard options are not sufficient for your task at hand.
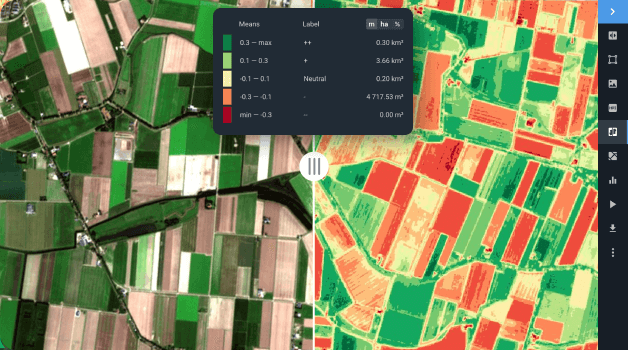
Change detection
Keep an eye on how land characteristics are changing over time by comparing different satellite images. No matter the focus — be it natural processes, disaster recovery, or urban growth — the change detection feature provides valuable insights across the board.
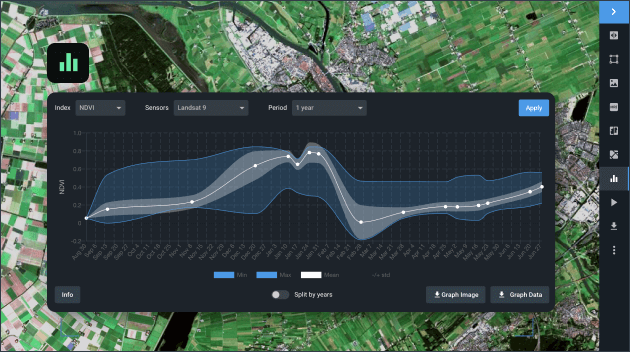
Time series analysis
Understand temporal patterns within your AOI by building spatiotemporal visualizations based on Landsat 5 imagery. Choose from a broad selection of indices to monitor shifts in landscapes, recurring vegetation phases, or signs of human activity. Evaluating data from multiple dates reveals gradual trends, cyclical changes, and accelerating processes to guide strategic decision-making across industries.
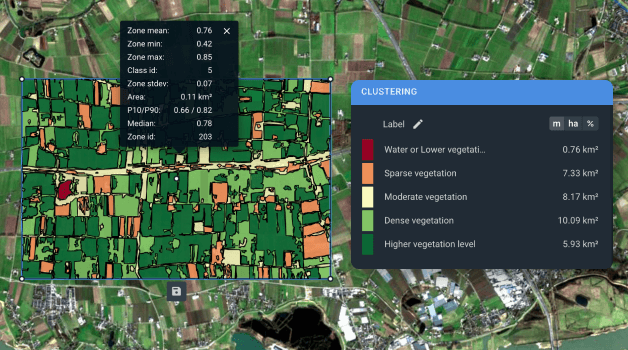
Clustering
Segment raw imagery into coherent zones with common index values through advanced clustering and vectorization. These algorithms generate two supplementary layers for your AOI, turning complex raster datasets into more interpretable spatial structures. With these layers, users can expose hidden vegetation variability, track hydrological conditions, and monitor shifts in land use. Applications span from crop management to coastal sustainability initiatives.