Landsat 4 images: Satellite data for historical analysis
-
Spatial resolution
30 m
-
Revisit time
–
-
Spectral bands
7 bands covering visible, NIR, SWIR, and thermal
-
Scene size
170 km x 185 km
-
Data archives
1982–1993
-
Analytical tools
Change detection, clustering, time series analysis
How to access Landsat 4 satellite images on LandViewer
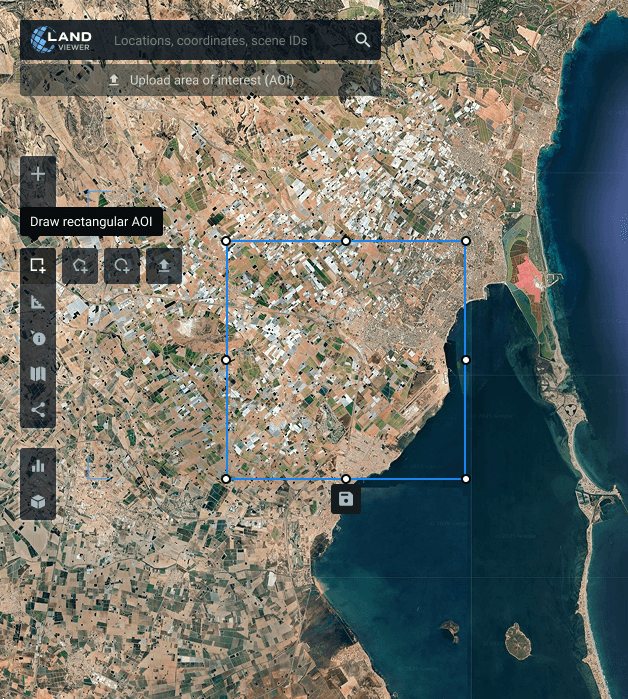
Define your target area
Choose the location you want to monitor by searching on the map, drawing boundaries, or uploading an existing AOI file from your device.
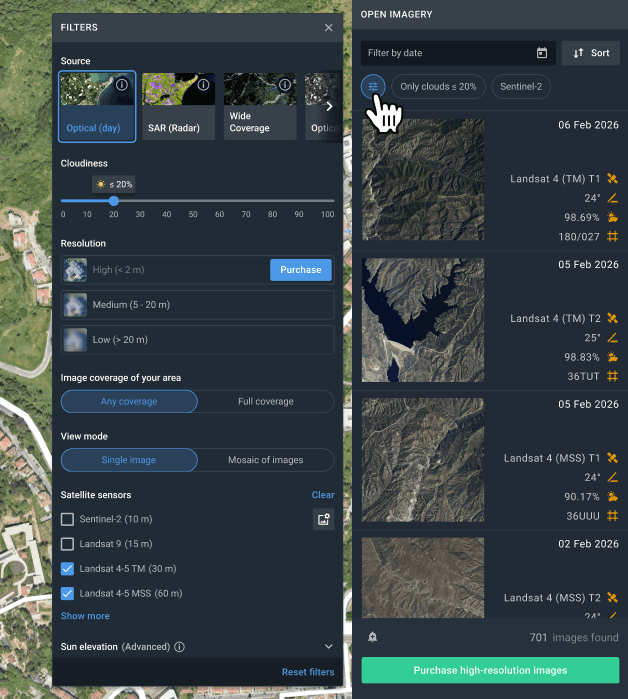
Narrow down your search with smart filters
Apply filters to quickly surface suitable Landsat 4 imagery by date range, cloud percentage, sensor type, and spatial coverage.
Choose the scene that fits your task
Review the search results and pick the image that best meets your project requirements.
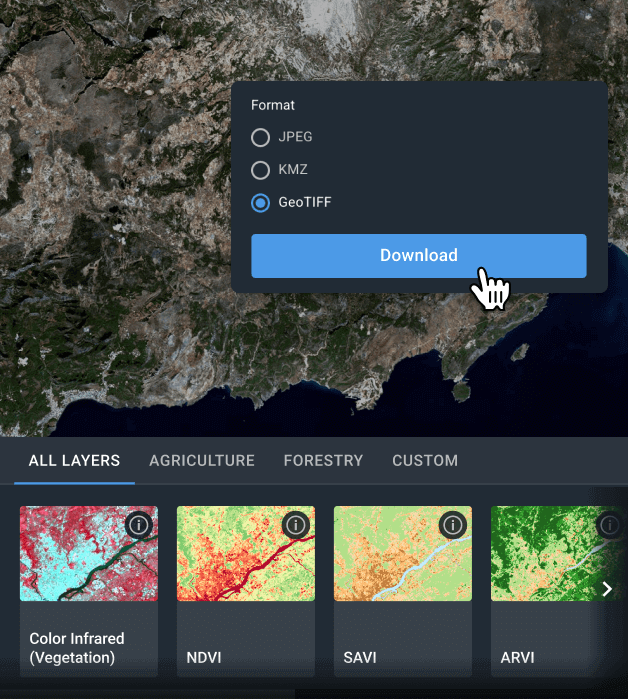
Download imagery or analyze online
Export selected Landsat 4 scenes in GeoTIFF, KMZ, or JPEG formats for external GIS workflows (for example, QGIS or ArcGIS), or process them directly on LandViewer using ready-made indices, band combinations, change detection, time series, and clustering tools.

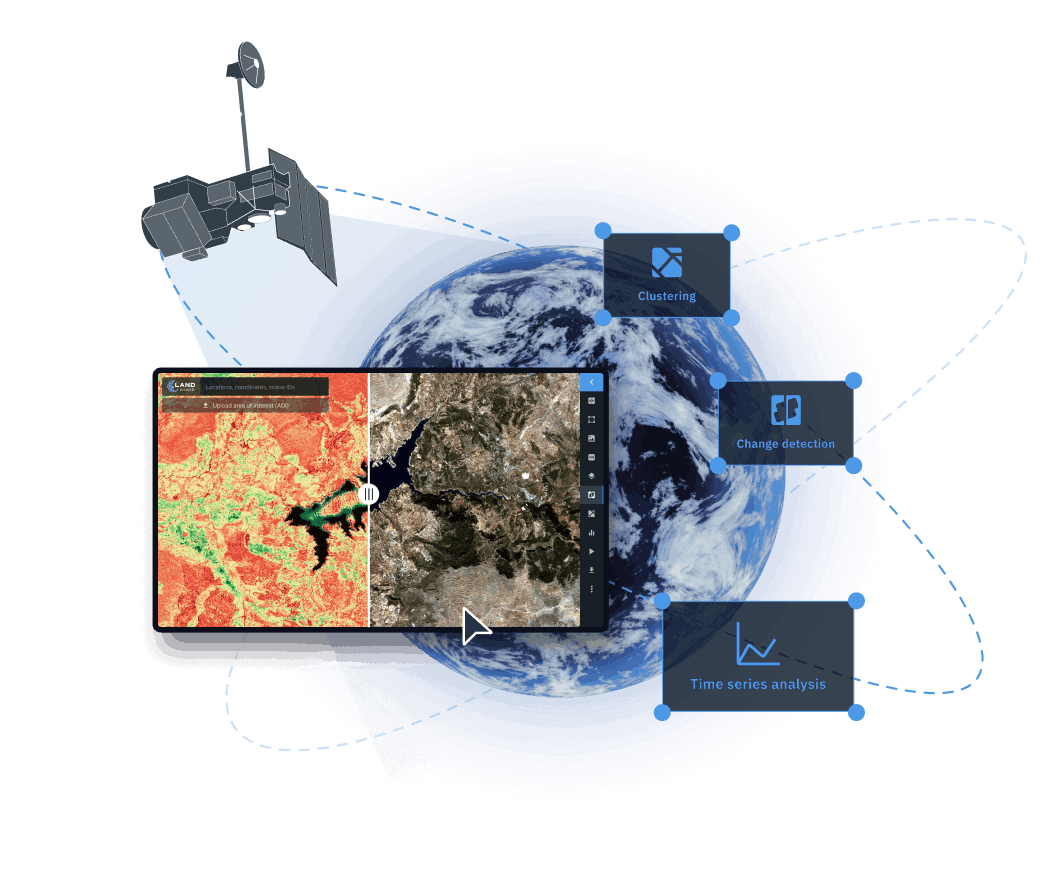
Get more insights from Landsat 4 with analytics on LandViewer
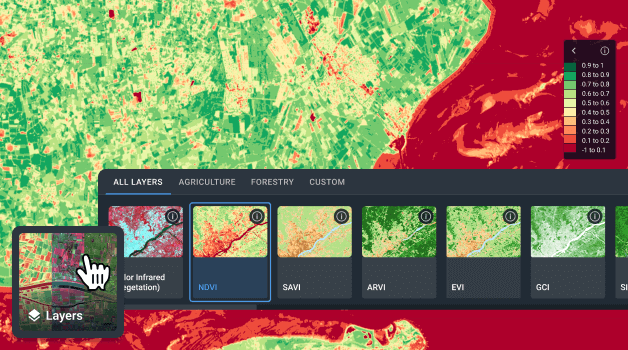
Indices and band combinations
Customize spectral band combinations to match your analytical objectives and enhance feature detection on Landsat 4 maps. LandViewer offers 20+ ready-to-use indices and band combinations for evaluating vegetation health, soil properties, and environmental stress. You can also design and apply your own index formulas to meet specific project requirements.
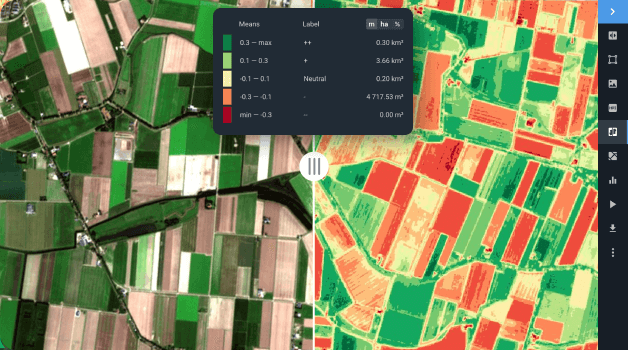
Change detection
Compare Landsat 4 scenes captured at different dates to reveal land transformation over time. Change detection tools provide reliable information for strategic planning and risk mitigation in numerous fields, from tracking urban growth to assessing post-disaster impacts.
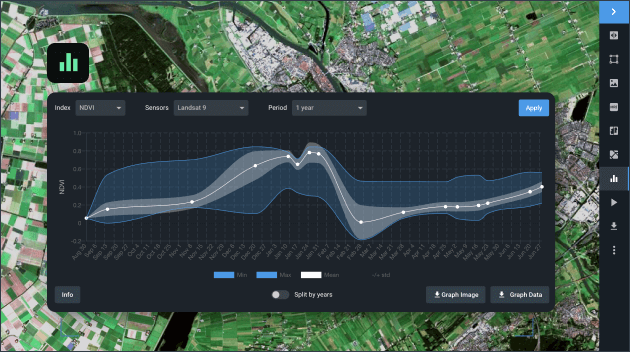
Time series analysis
Track how landscapes evolve by creating time-based visualizations for your AOI. Examine fluctuations in vegetation health, detect gradual shifts, and measure development intensity through multi-temporal analysis. By analyzing Landsat 4 data across different periods, the tool highlights long-term trends and seasonal variability, supporting informed planning and efficient resource management.
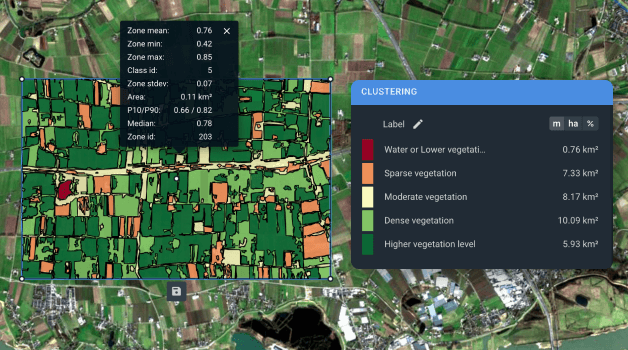
Clustering
Transform unprocessed Landsat 4 raster imagery into structured spatial segments by applying clustering and vectorization techniques. They group pixels with similar index values into distinct zones and produce two additional analytical layers within your AOI. This uncovers subtle vegetation patterns, supports water quality assessment, and enables accurate land cover monitoring, beneficial for many different industries.