CBERS-4 satellite images: Reliable recent and archival data
-
Spatial resolution
5–20m (60m for wide coverage sensor)
-
Revisit time
26 days
-
Spectral bands
Panchromatic, Red, Green, Blue, NIR
-
Scene size
60–120 km (684 km for wide coverage sensor)
-
Data archives
2014–present
-
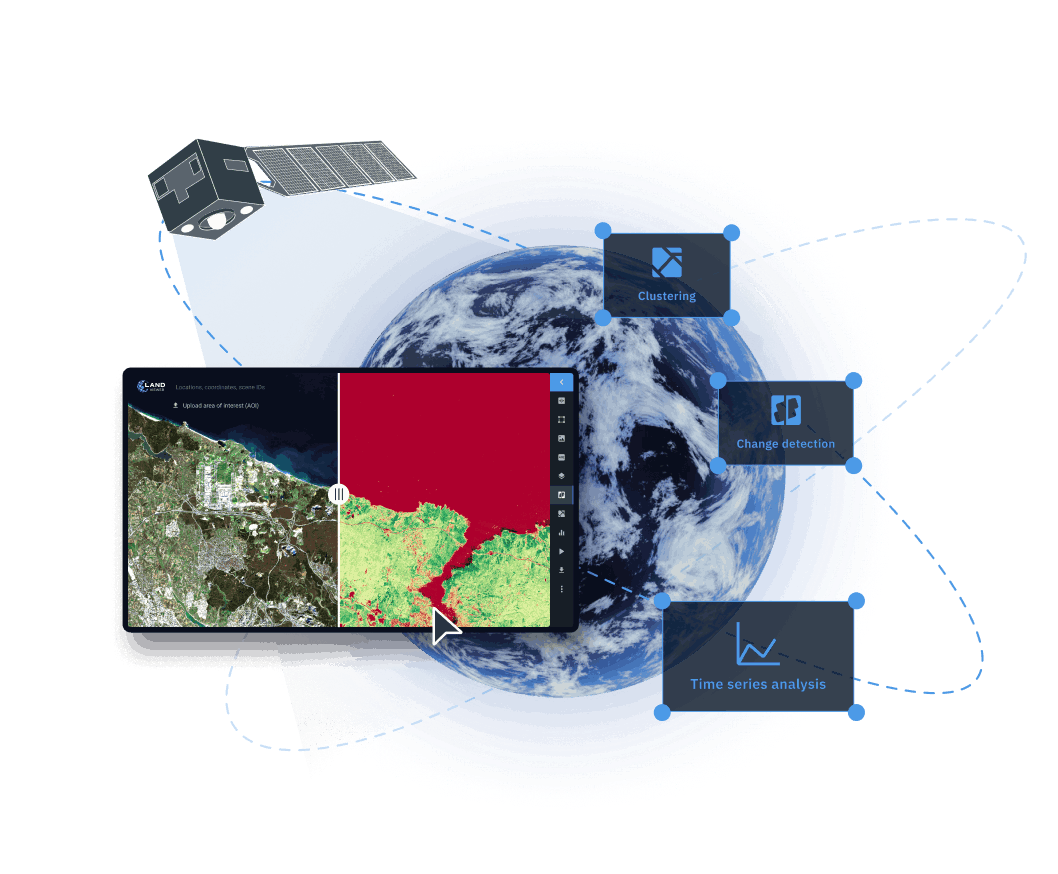
Analytical tools
Change detection, clustering, time series analysis
How to access CBERS-4 satellite imagery on LandViewer
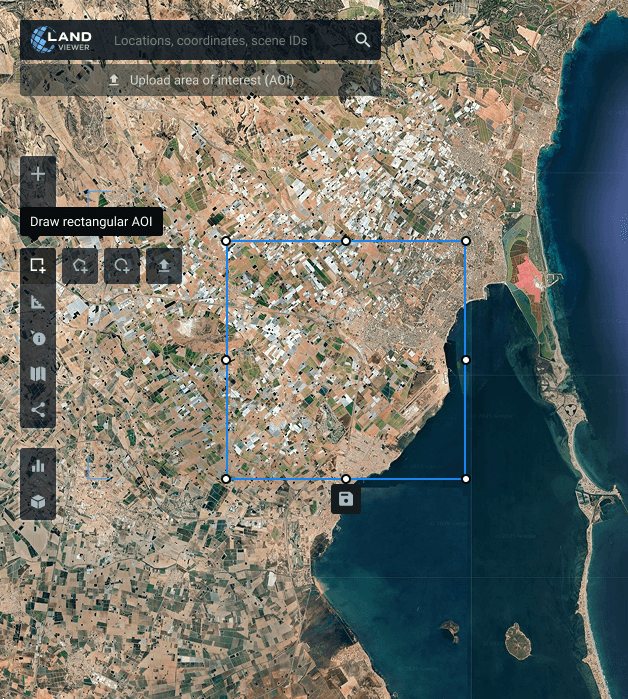
Define the area to monitor
Search for a location, draw your own AOI (area of interest) on a satellite map, or upload a saved boundary file to begin monitoring.
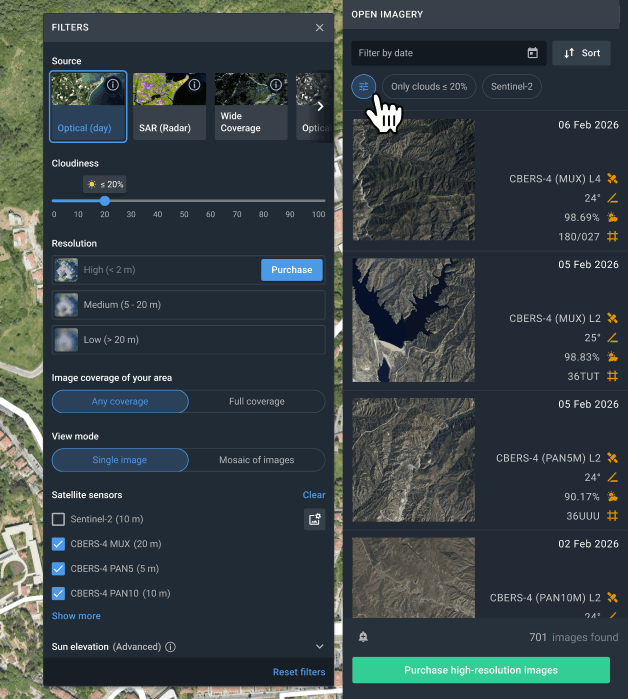
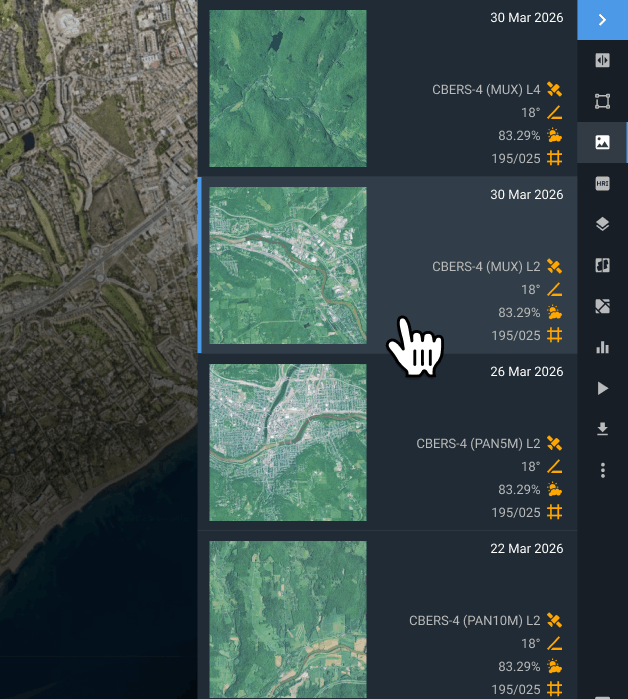
Apply filters to focus your search
In a few clicks, refine search results by acquisition date, cloud coverage, sensor type, and AOI overlap.
Choose a scene for your project
Review filtered imagery and select the option that best supports your research or operational goals.
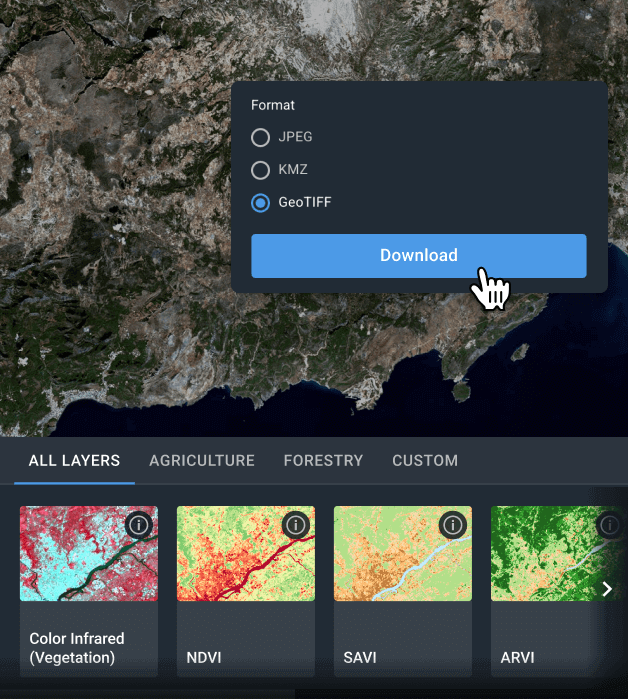
Export imagery or analyze directly in the platform
Choose how you want to work with CBERS-4 data. Download scenes for processing in external GIS environments, or analyze them within LandViewer using built-in indices, band combinations, and analytical features, including change detection and temporal analysis.
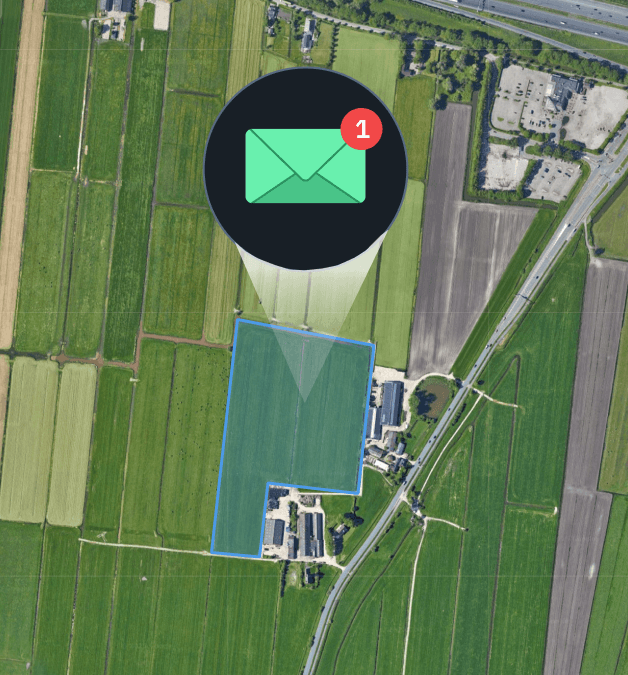
Get notified when new data arrives
Turn on email notifications to stay informed whenever new CBERS-4 satellite imagery becomes available for your area of interest.
Unlock valuable insights from CBERS-4 images with LandViewer
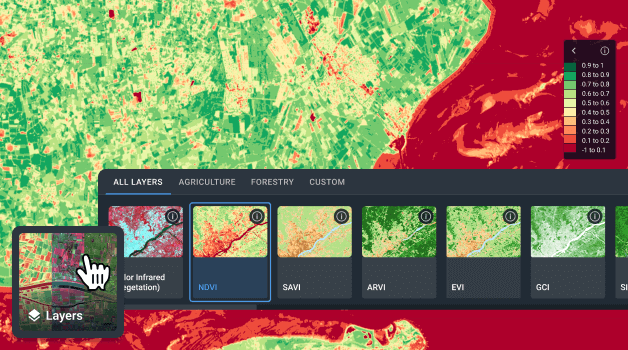
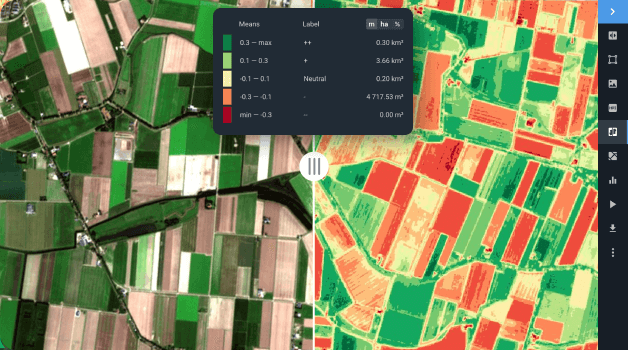
Indices and band combinations
To better identify objects and surface features on CBERS-4 maps, choose spectral bands that match your specific task. LandViewer includes ready-made indices and band combinations that help assess vegetation health, land properties, and signs of environmental stress. If the standard presets do not fully fit your workflow, you can build and apply your own custom index.
Change detection
By comparing satellite images from different dates, you can watch landscapes transform. Whether it’s a city expanding, ecosystems shifting, or disaster recovery unfolding, a change detection tool provides the clarity needed for better planning and risk management.
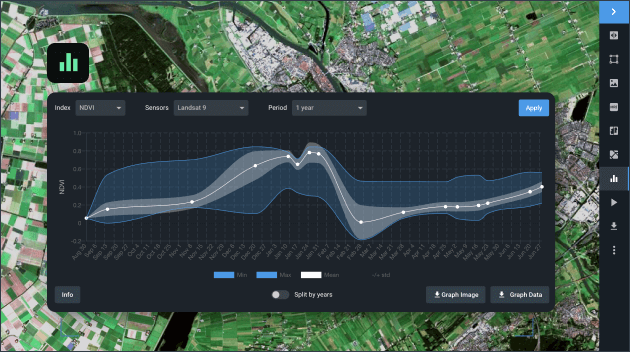
Time series analysis
To see the bigger picture, generate spatiotemporal graphs for your chosen area. With the right indices, you’ll uncover vegetation cycles, human footprints, and long-term land changes. The system analyzes CBERS-4 data across multiple periods, showing seasonal variations and urban growth trends — insights that help industries plan ahead and use resources wisely.
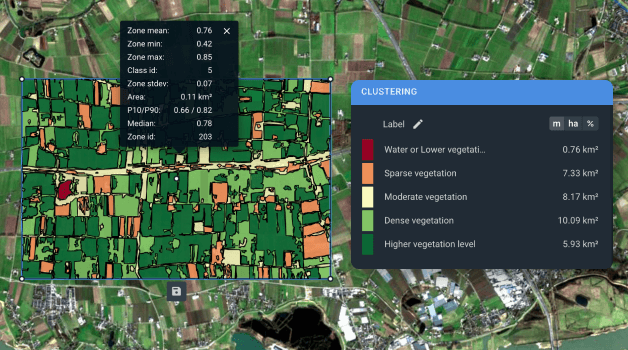
Clustering
Clustering and vectorization give structure to raw CBERS-4 raster data, dividing it into zones with similar index values. These new layers reveal hidden vegetation patterns, water dynamics, and land cover shifts. From forest management to urban sprawl monitoring, industries gain a sharper view of the environment and its changes.