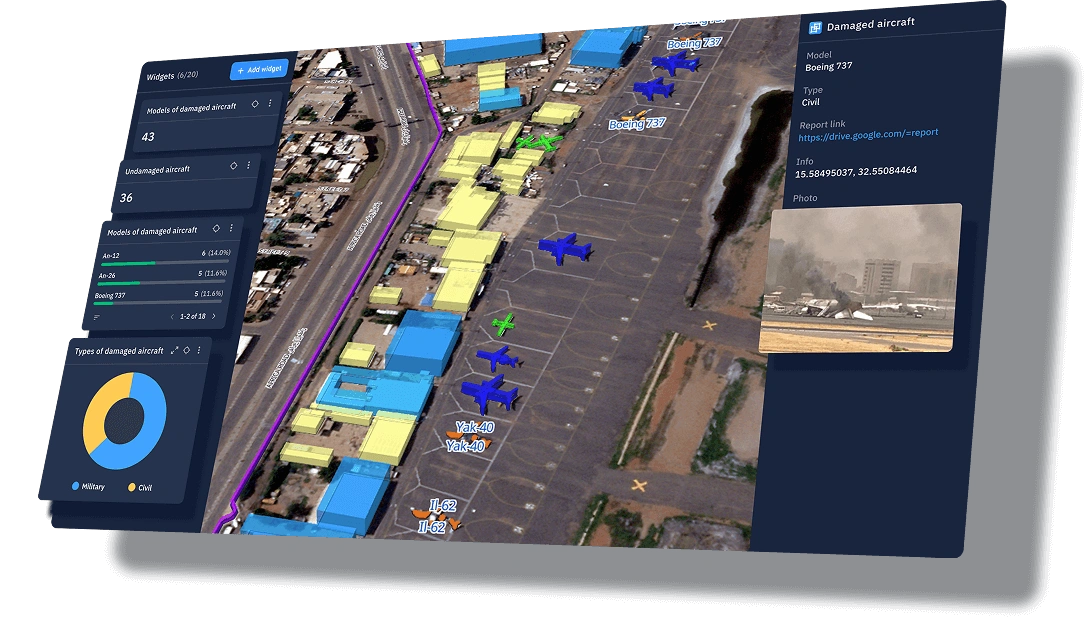
Multi-industry satellite analytics and AI-powered intelligence
Get actionable AI-driven insights. Track objects, changes, and impacts across your AOIs with smart 3D maps and reports.
The outputs tailored to your workflow
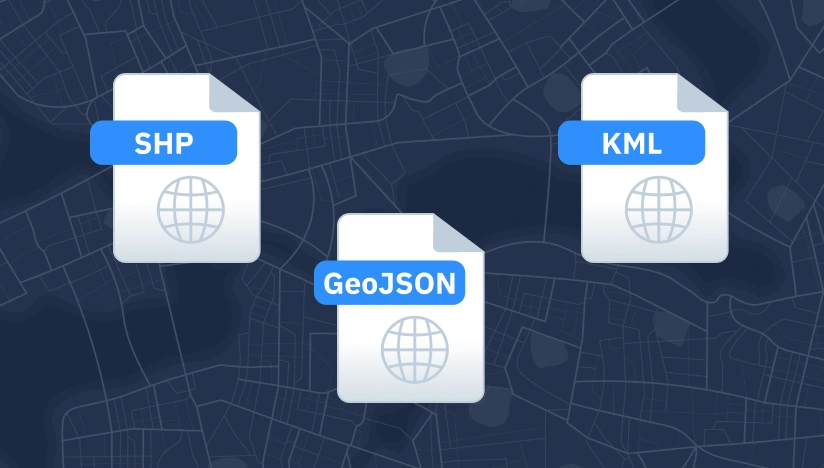
Original data layers
Receive GEOJSON / KML / SHP datasets and upload them wherever you want.
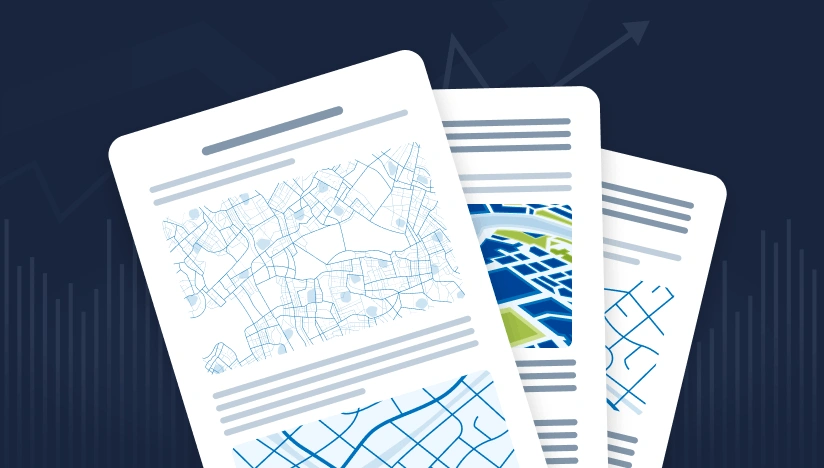
Decision-ready PDF report
Actionable report summarizing key findings for rapid response and easy sharing.
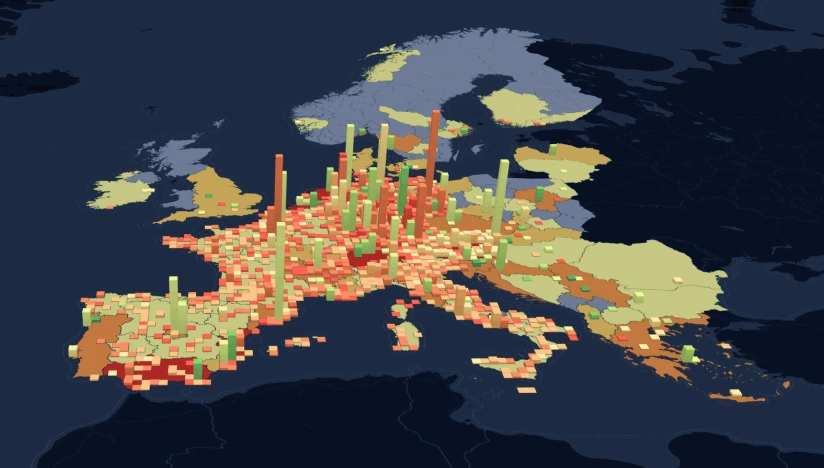
Interactive smart map
Cloud-based interactive map with 3D view for clear visualization and spatial analysis.
Our solutions to support multi-industry satellite monitoring
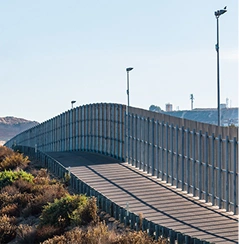
Border security
Monitor vast perimeters with satellite analytics from a single view: detect new trails, staging areas, and anomalies. Gain complete visibility over borders to improve patrol efficiency, response speed, and territorial control.
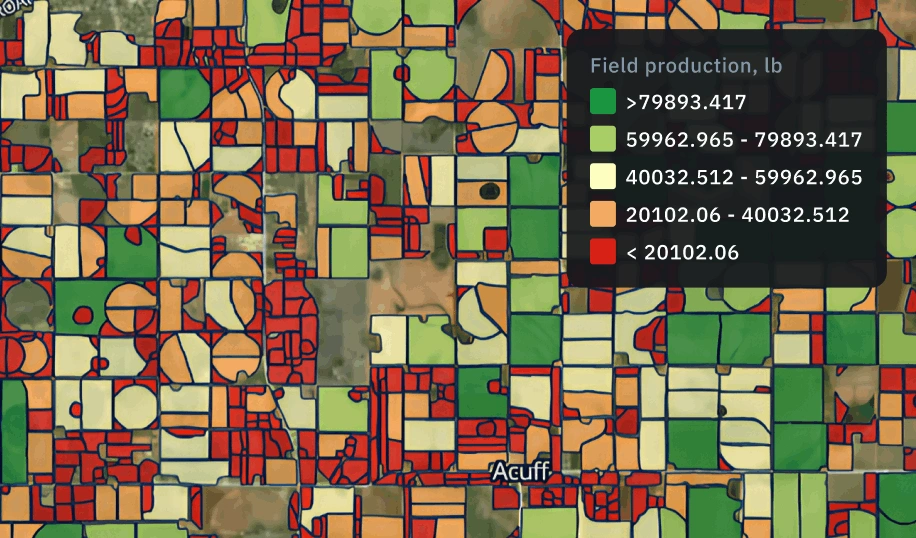
Yield prediction
Secure your bottom line with biophysical and ML-powered forecasts. Predict yields early in the season to optimize trading strategies, manage storage capacity, and ensure supply chain stability across regions.
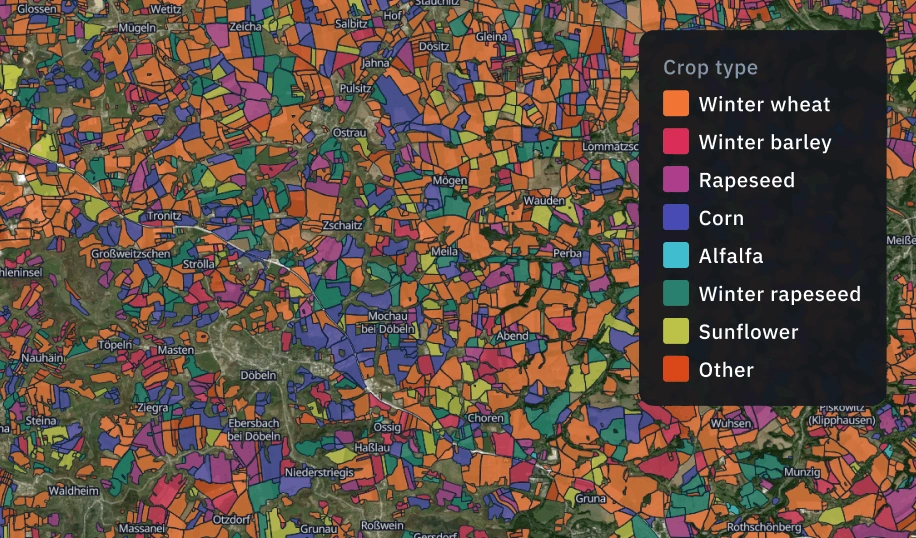
Crop сlassification
Get precise crop type maps and field boundaries thanks to bespoke EOSDA's ML models. Reliable satellite-based insights on crop types allow you to enhance supply chain planning and regional analysis.
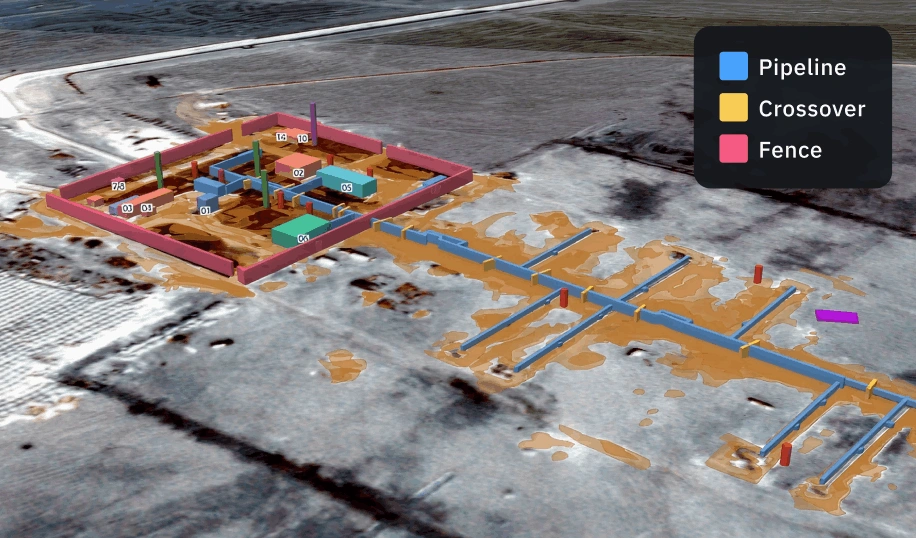
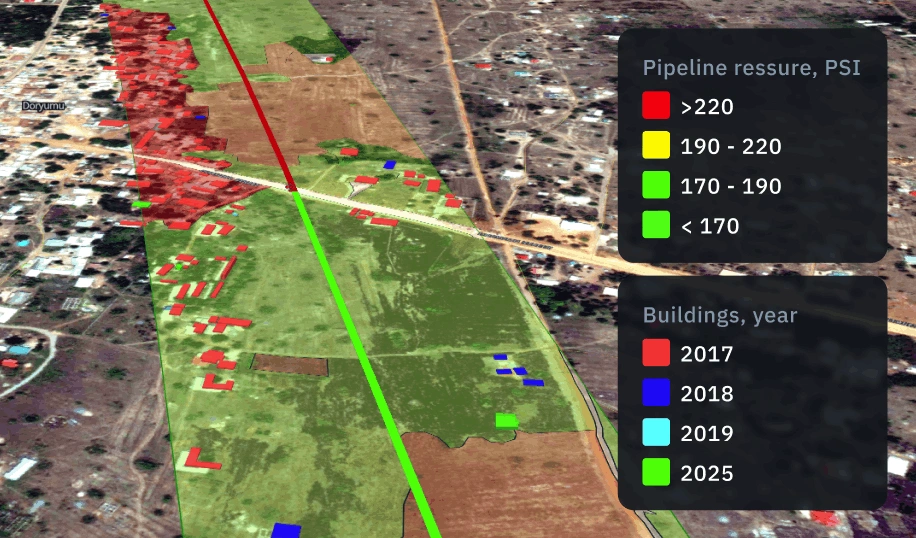
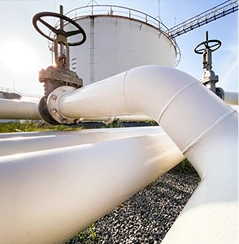
Infrastructure monitoring
Monitor all assets with satellite analytics from a single view: pipelines, dams, mines, wells, equipment, and facilities. Gain complete visibility over infrastructure to improve safety, efficiency, and operational control.
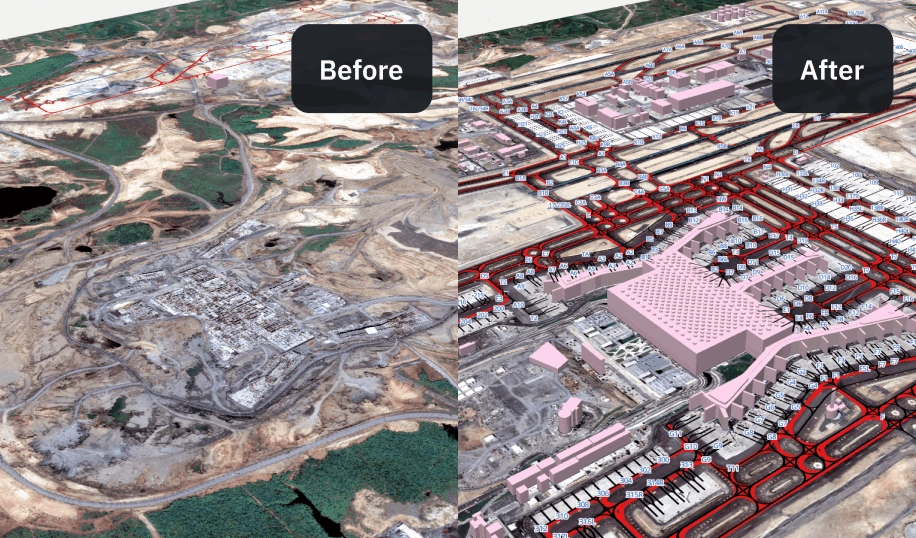
Сhange detection
Spot meaningful changes over time with satellite imagery and ML-powered alerts for faster decisions and risk management. Clear before/after insights so teams can respond efficiently and prevent operational issues.
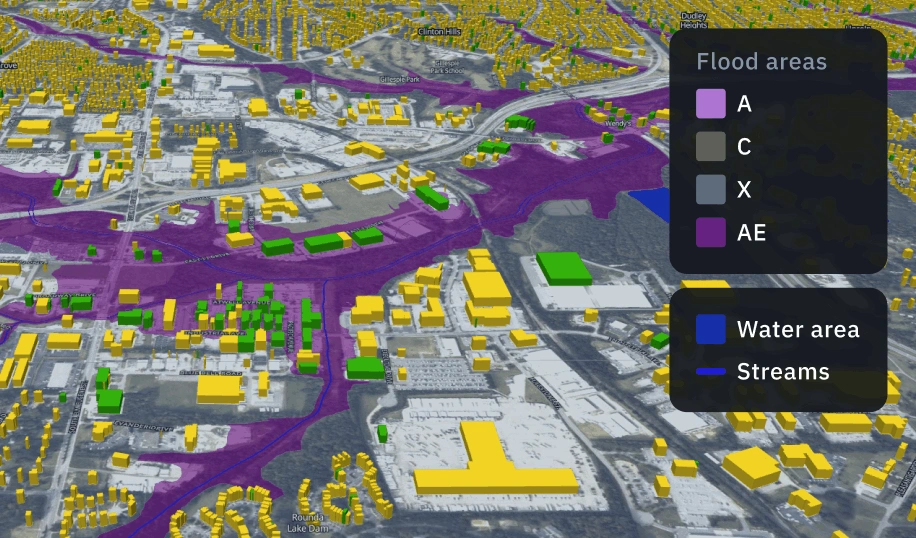
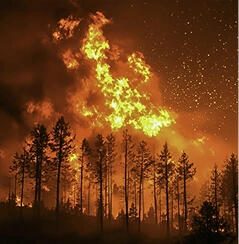
Damage mapping
Quickly identify flood-affected areas, damaged assets, and contamination zones to speed up response, verify claims, and minimize losses.
Why choose EOS RayVision for your tasks
Decision-ready insights
Skip manual analysis with prioritized signals and evidence packages ready for immediate action.
Multi-sensor monitoring
Maintain visibility through clouds and smoke by using a tailored mix of optical and SAR sensors.
Reusable ML/AI models
Scale fast across domains using proven ML building blocks without reinventing from scratch.
Reliable outputs every time
Get trustworthy insights for every decision through our standardized validation and QA logic.
Delivery that fits your operating model
Align cadence, thresholds, escalation logic, and delivery formats with your existing workflows.
Built for portfolio-scale monitoring
Run the same logic across more AOIs and assets while maintaining uniform output quality and speed.
Featured case studies
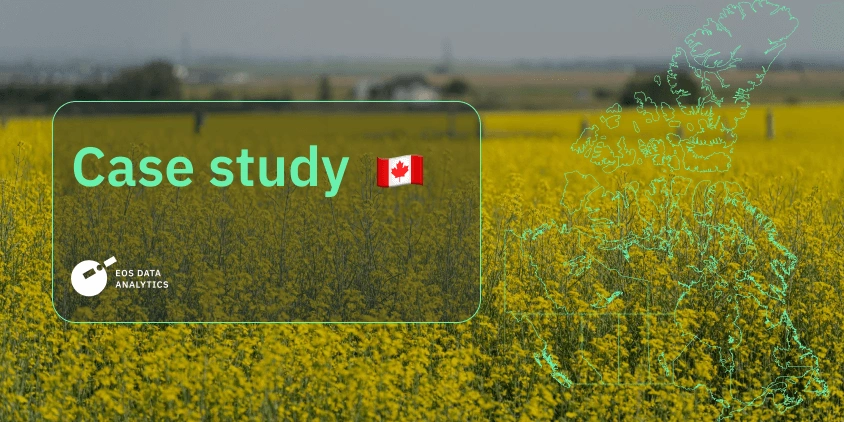
Market-ready early yield forecasts in Saskatchewan for trading & procurement
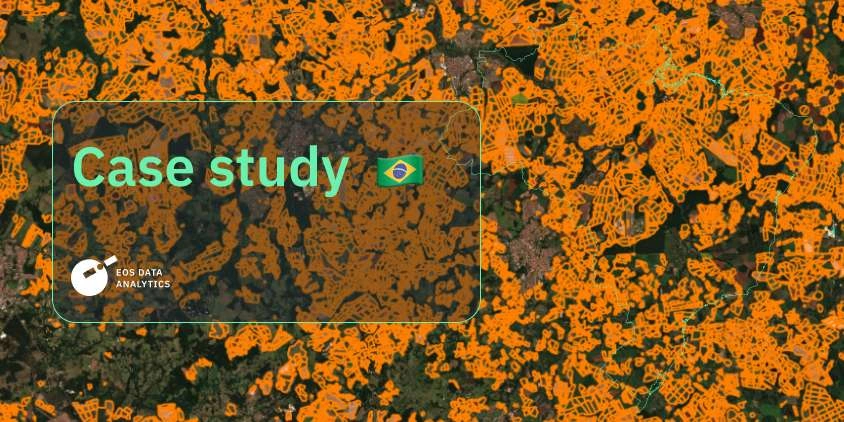
Validated sugarcane mapping for confident risk decisions in São Paulo
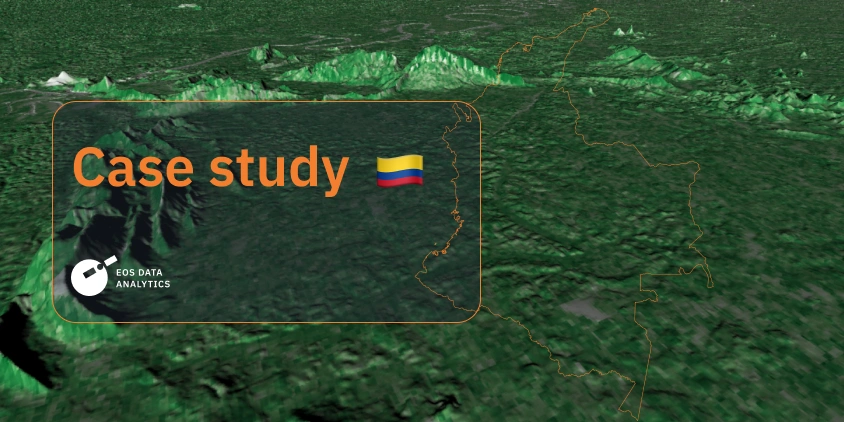
Land use analysis for portfolio due diligence in Colombia


Our trusted satellite data providers


FAQ
What exactly is EOS RayVision?
EOS RayVision is a satellite-based, AI-powered monitoring and intelligence platform where you define areas of interest and detection goals — such as change, objects, and impacts — and receive structured outputs for operations and reporting.
What types of problems does EOS RayVision solve best?
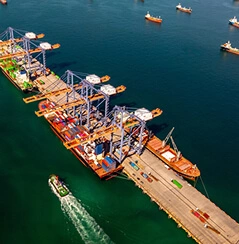
EOS RayVision performs best in large-scale, repeat monitoring scenarios: infrastructure and corridor watch, site activity tracking, maritime and logistics visibility, disaster impact assessment, security monitoring, and portfolio-level risk or compliance workflows.
What data sources do you use?
We use optical and radar (SAR) imagery and can combine multiple sources when needed. We can also apply thermal and hyperspectral sensors in specific cases. The sensor mix is selected based on revisit, resolution, cost, and reliability constraints for your AOIs.
How often can you update the results?
Update frequency ranges from event-driven monitoring to scheduled recurring updates, depending on your AOIs, sensor strategy, and analytics type. We set alert thresholds and monitoring intervals to match your decision cycle and ensure you don't miss a critical change in your areas of interest.
What do you need from us to start?
To begin, we need your AOIs (as polygons or asset lists), monitoring goals, priority events to detect, and success criteria, such as KPIs, thresholds, or decision SLAs. With these inputs, our team proposes the sensor strategy, outputs, and the monitoring cadence.
How do I receive the outputs?
Outputs are delivered in the format that best fits your workflow. This could be the platform visualization module, map layers or packaged outputs (e.g., GeoJSON / Shapefile / GeoTIFF), structured summaries, and reporting templates.
Which industries benefit from EOS RayVision the most?
We serve industries where real-time situational awareness is critical, including security, critical infrastructure, disaster management, maritime and logistics, oil, gas, and mining, finance and insurance, agriculture, and forestry. EOS RayVision provides a decisive edge whenever knowing exactly what changed outperforms slow, manual monitoring and costly ground operations.