MODIS images: Daily satellite views for informed land analysis
Get MODIS daily, low-resolution (250m), global-coverage satellite imagery on the EOSDA LandViewer platform to monitor environmental and climate dynamics:
-
Spatial resolution
250 m to 1 km
-
Scene size
2,330 × 2,330 km
-
Revisit time
Daily
-
Data archives
Global (since 2000)
-
Spectral bands
36 bands from visible to thermal infrared
-
Analytical tools
Vegetation and thermal indices
How to get MODIS satellite imagery on EOSDA LandViewer
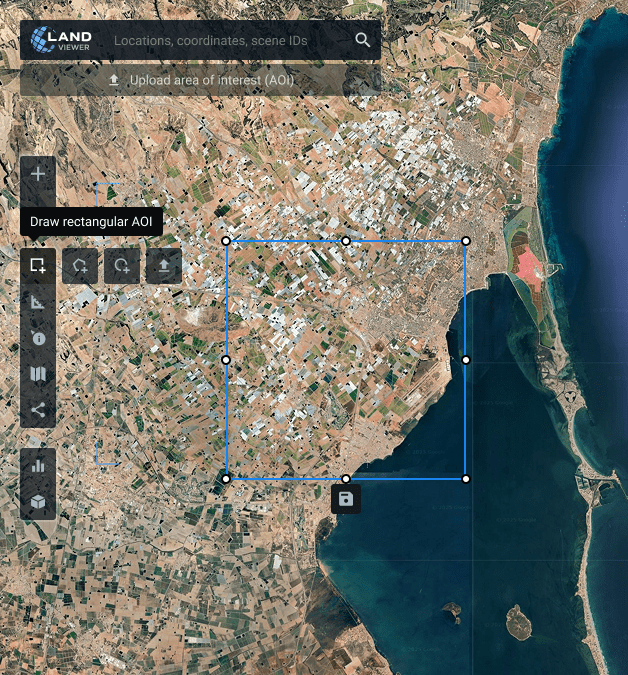
Specify your area of interest
Set the area of interest (AOI) you'd like to monitor. You can search for it by location and draw manually on the map or simply upload the boundary file.
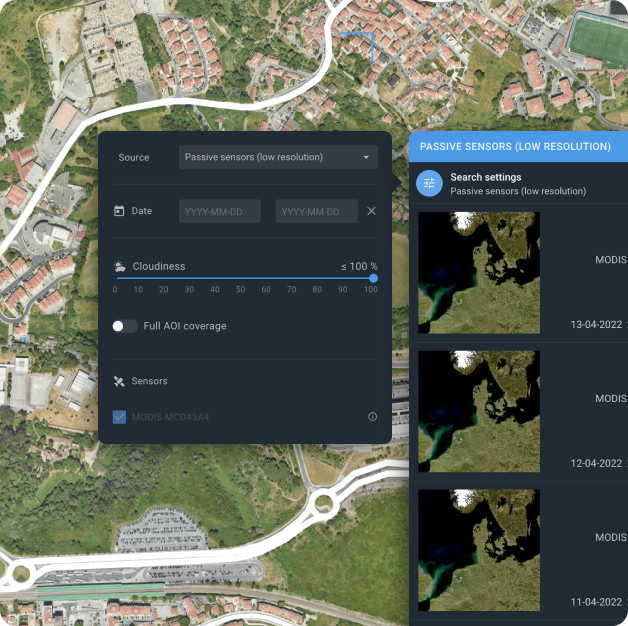
Narrow down search results with filters
Easily find scenes that match your criteria by applying relevant filters: date, cloudiness, type of sensor, or area coverage.
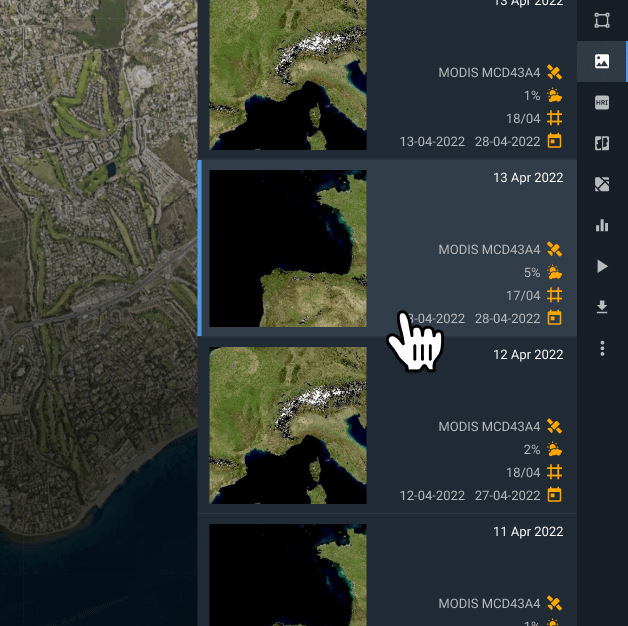
Pick the scene for your needs
Browse through the filtered scenes and pick the most suitable one based on your specific project needs.
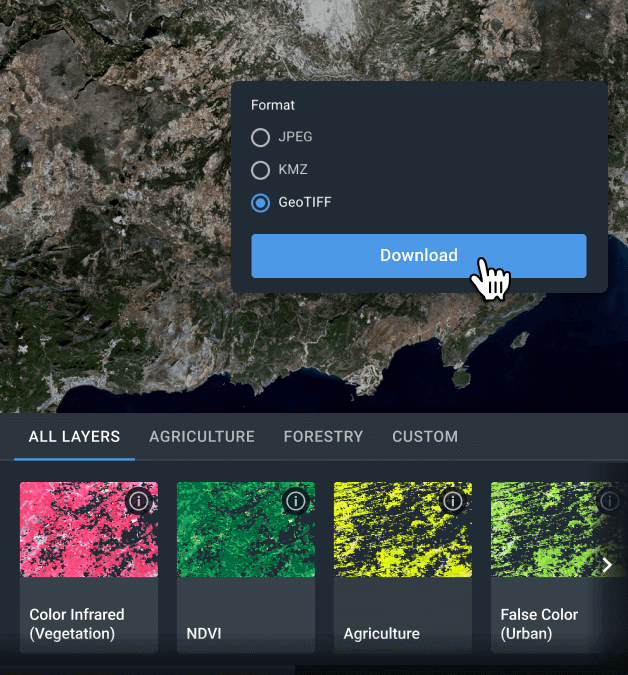
Download the scene or analyze it online
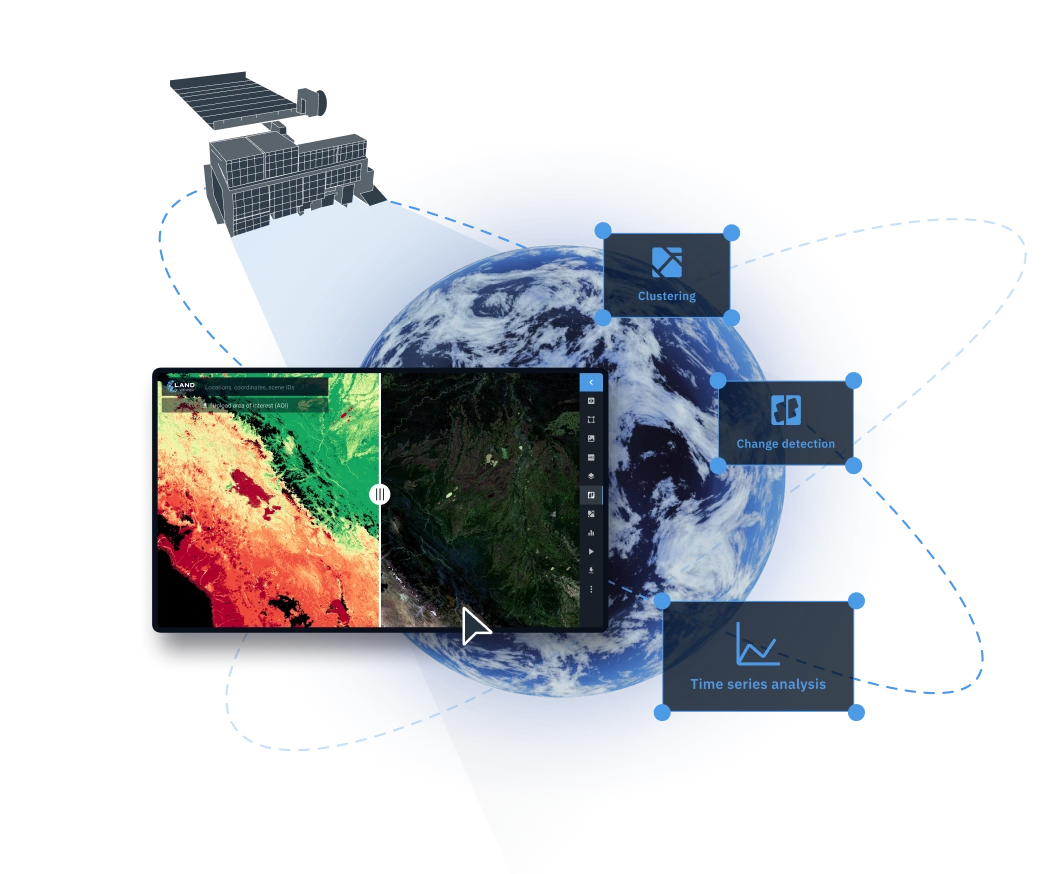
You can download selected MODIS satellite data in GeoTIFF, KMZ, or JPEG formats and continue working with it in tools such as QGIS or ArcGIS. Alternatively, analyze the scene directly on EOSDA LandViewer using indices, band combinations, and advanced features like time series, change detection, or clustering.
Get useful insights from MODIS satellite images with EOSDA LandViewer
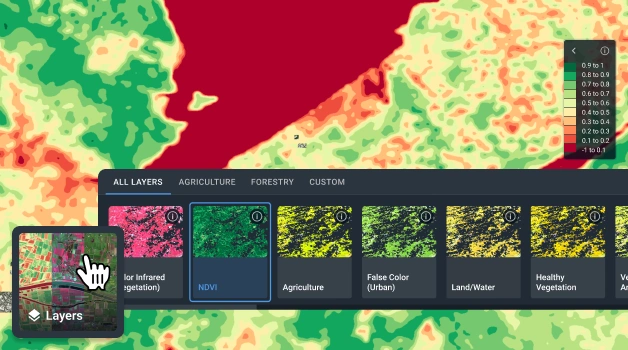
Indices and Band Combinations
EOSDA LandViewer helps you save time when processing MODIS data. Instead of setting up complex tools, you get direct access to over 20 ready-made vegetation indices and band combinations — all optimized for monitoring different types of environmental changes. If you need something specific, you can set up and apply your own, custom indices.
How to use MODIS data for real-world land and vegetation analysis


Assessing Australian bushfires
- East Gippsland, Victoria, Australia
- Vegetation analysis band combination
- Dec 3, 2019 – Feb 21, 2020


Analyzing deforestation in the Amazon
- Canutama, Amazonas, Brazil
- NDVI index
- Jul 30, 2020 – Sep 15, 2021


Drought monitoring in the Southwestern US
- Area between Tucson and El Paso, Arizona, USA
- NDWI index
- Jul 31, 2020 – Aug 06, 2021