
EOSDA Forecasts Yields For 2025 In Saskatchewan
Yield forecasts are most valuable for farmers when they arrive early enough and are specific enough to guide management decisions. In Saskatchewan, Canada, where changes in temperature and precipitation can quickly affect yields, broad estimates often leave too much uncertainty at the local level.
EOSDA’s project focuses on closing this timing and scale gap by forecasting crop yields at the Rural Municipality level during the growing season. Instead of treating Saskatchewan as a uniform production zone, our forecasting solution follows how local weather patterns shape yield expectations for major crops as the season unfolds. In our study, we looked at how crop yield forecasts changed from early to mid-season to highlight how up-to-date, localized data can help fill gaps in planning, managing risks, and reacting to fast-changing weather conditions.
| Challenge | Official yield forecasts available to Saskatchewan crop producers lack the spatial detail and timing needed to respond to fast-changing weather conditions during the growing season. |
| Solution | EOSDA applied a hybrid forecasting approach that combines satellite data, weather metrics, and long-term yield statistics to deliver RM-level estimates for key crops twice during the season. |
| Outcome | The forecasts captured meaningful yield insights across Saskatchewan RMs. Results reflected both regional trends and local variability to better support farm-level planning and risk management in the province. |
Overview: Agricultural Market Of Saskatchewan
Saskatchewan is a key agricultural region in Canada, accounting for more than 40% of the country’s cultivated farmland . Grains and oilseeds make up the bulk of crop production. In 2025, spring and durum wheat covered around 14 million acres, while canola reached 12 million acres . Lentils and dry peas are also widely grown, though on fewer acres than grains and oilseeds.
Despite ongoing dry conditions and droughts affecting over 80% of the province in recent years, crop producers have demonstrated remarkable resilience through innovation and adaptation . However, the Saskatchewan Crop Insurance Corporation reported $1.14 billion in crop insurance indemnities for 2024–2025, far surpassing budget projections . Prolonged mid-summer heat and drought, followed by rainfall near harvest time, caused quality losses in many crops.
This situation shows how rapidly weather volatility disrupts farm income and increases risks. Better yield forecasts can help farmers adjust quickly (for example, by insuring and salvaging crops or planning feed during dry spells).
Challenge: Insufficiency Of Official Yield Forecasts For Local Decisions
Yield forecasts are meant to inform operational decisions for Saskatchewan farmers. In 2025, though, the official forecasts did not fully live up to that role. At the Rural Municipality level, they lacked the detail and speed required for in-season planning. This made it difficult to apply them directly on the farm.
Let’s examine the main reasons why official yield predictions are insufficient for Saskatchewan rural communities:
- Scale too broad for local decisions. Official forecasts are developed at regional or municipal levels. Research on Canadian Prairie crop yield estimation demonstrates that municipality-scale models, while useful for broad market analysis, cannot capture the field-level variations that directly impact individual farm management decisions .
- Forecasts arrive too late. Most official estimates reflect conditions weeks before publication. By the time farmers receive updated numbers, key management windows have already passed. Thus, official forecast schedules cannot provide near real-time information required for field decisions.
- Limited accuracy under variable weather. Weather variability remains a major challenge for yield forecasting in the Prairies. In 2025, drought conditions through July were followed by improved moisture in August, which significantly affected final yields. Official models struggled to reflect these rapid changes, resulting in differences of several bushels per acre between some forecasts and actual yields.
In practice, these limitations make official yield forecasts less useful for Saskatchewan crop producers. Farmers need more localized, timely, and weather-focused insights to manage risk and respond effectively to changing conditions.
Solution: RM-Level Yield Forecasting For Major Crops In Saskatchewan
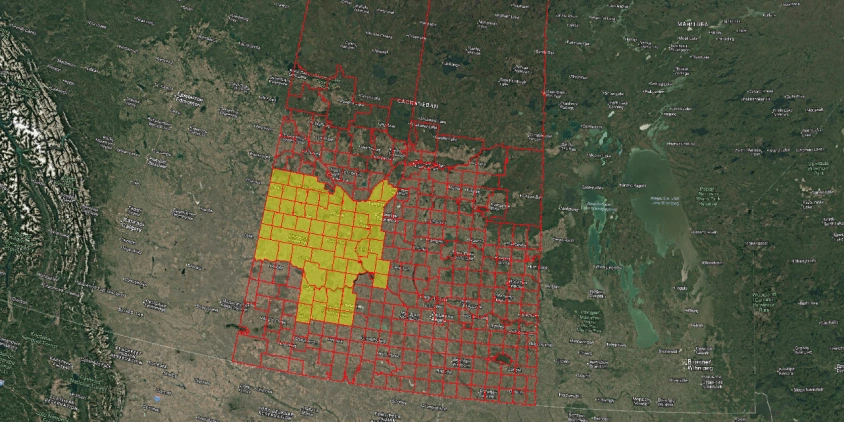
EOSDA’s solution delivered early crop yield forecasts for the 2025 growing season at the Rural Municipality (RM) level in Saskatchewan.
We’ve focused on the Rural Municipality level to make sure our forecasts are practical and actionable for farmers. Broad provincial averages are often useless when one RM is suffering from drought while another just 50km away is thriving.
The goal was to make yield estimates available sooner than official sources, without sacrificing spatial detail. The analysis covers major local crops, such as wheat, canola, pea, chickpea, and lentils across selected RMs.
To build the forecasts, our science team combined satellite imagery, agricultural weather data, and historical yield records into a single hybrid methodology. MODIS-based satellite indicators from 2000 to 2025 helped assess crop condition and discover key patterns:
- NDVI (Normalized Difference Vegetation Index) represents vegetation health;
- NDWI (Normalized Difference Water Index) indicates soil moisture status, including drought stress;
- LST (Land Surface Temperature) helps identify heat stress in plants.
Weather data plays a key role in our forecasting solution. We used accumulated Growing Degree Days (GDD), total precipitation, and indicators of temperature extremes. Agricultural weather data adds precision to the model and helps more accurately predict yield outcomes at the RM level.
To establish a strong historical baseline, we used publicly available yield data from Saskatchewan Agriculture covering 2000–2024. These records were matched to RM boundaries and used to train and validate the forecasting model. This long-term dataset supports consistent and robust yield estimation.
The analytical core of our forecasting solution is a LASSO (Least Absolute Shrinkage and Selection Operator) regression model. It allows our science team to focus on the most important variables while reducing noise from less relevant inputs. LASSO also prevents overfitting, ensuring that the model generalizes well and performs reliably on unseen data. Leave-one-out cross-validation was used to fine-tune the model.
Forecasts are produced twice during the growing season. An initial forecast is provided for the end of June to reflect early-season conditions. An updated forecast for the end of August incorporates mid-season crop development and revised weather impacts.
Outcome: Accurate Crop Yield Forecasts Across Saskatchewan RMs
The EOSDA yield forecasting solution showed how crop yield expectations changed between early and mid-season at the Rural Municipality level across Saskatchewan. By comparing June and August 2025 forecasts, we’ve captured how weather and moisture conditions influenced crop development as the season progressed. In most cases, August estimates were higher than June, driven by improved weather conditions later in the season.
Results varied by crop and location, highlighting the value of RM-level analysis. While general regional trends were evident, the forecasts also captured local declines in areas where crops were exposed to heat stress or limited rainfall. This balance between consistency and local detail was one of the key outcomes of the study.
The main outcomes by crop discovered with the EOSDA forecasting solution are:
- Canola. Most RMs showed a moderate increase of 2–6 bu/acre by August, especially in central and northern areas. A few southern RMs showed declines due to water and/or heat stress.
- Lentils. The highest variability was observed in this crop. Some RMs showed substantial increases, while others declined, reflecting high sensitivity to mid-summer extreme heat and moisture stress.
- Peas. Yield changes mainly were positive but small, typically with an increase of 1–4 bu/acre. Peas showed greater stability during reproductive stages than, for example, lentils.
- Wheat. This crop showed the most consistent improvement, with many RMs gaining 4–7 bu/acre due to favorable late-season weather conditions.
- Chickpeas. Where data was available, all updates were positive, with a large increase in several western and southern RMs.


Overall, the project demonstrated that EOSDA’s approach can deliver meaningful yield forecasts at the RM level, even with limited input data. The EOSDA methodology provides a solid base that can be further strengthened through additional data sources and expanded to finer spatial scales, including individual fields.
About the author:
Maksym Sushchuk is at the forefront of realizing EOSDA's vision to make space tech a global driver of sustainability on Earth. He has over 15 years of experience in journalism and content creation for prominent Ukrainian startups, charitable funds and ESG businesses. As Head and Co-founder of PR Army Maxim brings attention to the human and social tolls of the aggression against Ukraine.
Recent articles
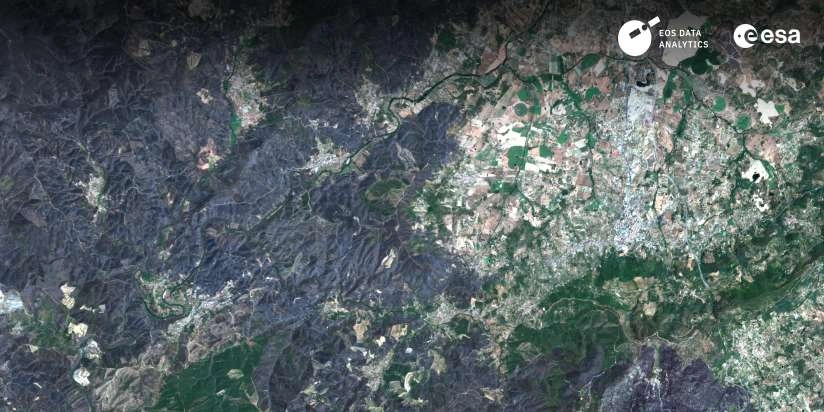
EOSDA to Monitor Wildfires in Portugal Using Satellite Data Under ESA’s InCubed Programme
The company signed a contract with ESA to create an innovative satellite-based solution for forest monitoring and wildfire prevention.
Digital Tools Improve Soil Health And Yields In Mexico
EOSDA and ITTA supported a Guanajuato farm with contour-line planning, monitoring tools, and practical guidance to reduce soil erosion and improve yields in the long run.

Analyze 2025 & Plan Your Best Year Yet: LandViewer Christmas Offer
It’s the most wonderful time of the year! The Christmas holidays are here, and so is your chance to analyze 2025 and plan a prosperous 2026 with more affordable Pro plans in LandViewer.