Sustainable forestry solutions powered by satellite data
Unlock the power of satellite-driven insights to monitor forest health, detect deforestation, and support sustainable land management with EOSDA's custom forestry solutions.
- High-accuracy forest change detection
- Scalable, flexible monitoring of the most remote areas of the forest
- Compliance-ready analytical reports

Tailored forestry solutions by EOS Data Analytics
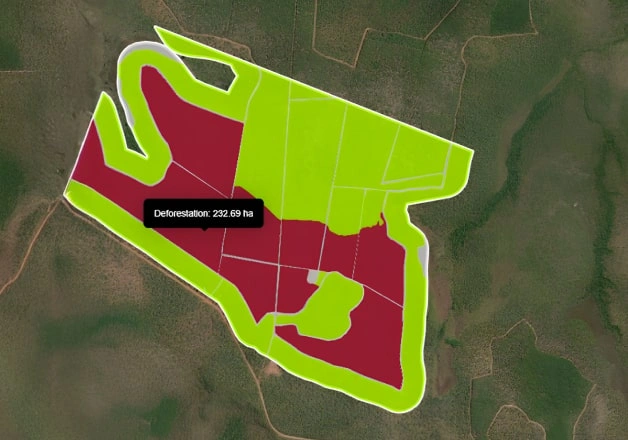
Forest cover, deforestation, and reforestation detection
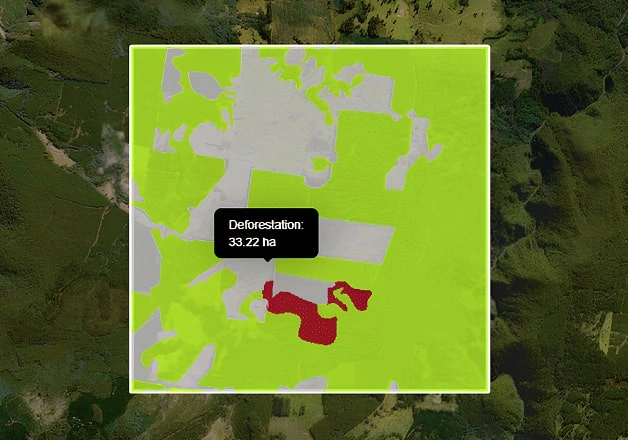
Forest cover, deforestation and reforestation detection is the analysis of changes in the forest structure over a specific period.
Methodology
- EOSDA uses data from Sentinel-1/2, or other satellites (including the EOS SAT-1 satellite) to detect changes with the highest accuracy. Detection is carried out based on the analysis of the measurements of the forest's spectral characteristics.
- EOSDA may employ ML technologies to improve cost and time efficiency. The model receives 2 images for different dates at the input and generates a forest/deforestation mask for the period.
Inputs required
- Area of interest (AOI) in .kml or .shp format.
Expected output
- Raster or vector deforestation/reforestation layers.
- Analytical report.
Forest burned areas detection
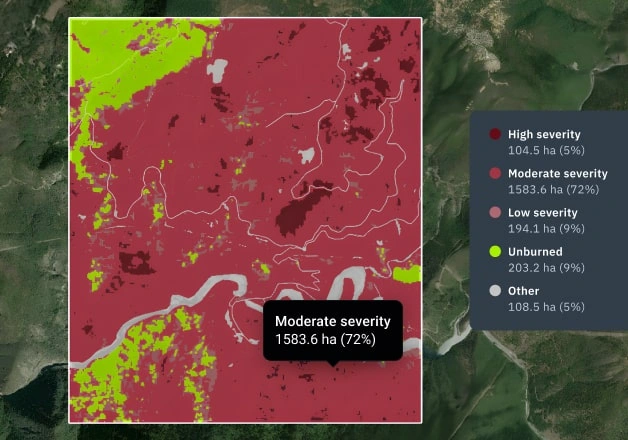
Assessment of burnt forest areas determines the location of burnt forest due to fires in a particular area.
Methodology
- Currently, it works in a semi-automated mode, but we are working on automating the solution further.
- EOSDA can analyze the area of interest, and with the help of various sources of satellite data, evaluate the burnt forest territories and classify the degree of damage.
- Different monitoring frequencies may be considered depending on the type of input data and the needs.
Inputs required
- Area of interest (AOI) in .kml or .shp format.
Expected output
- Raster or vector layers with marked burned forest areas (ha/acre, %).
- Analytical report.
Forest health analysis
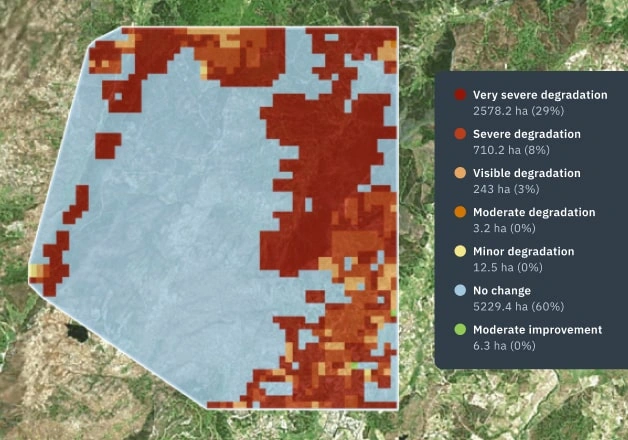
Forest health analysis can include historical and/or current data about changes in forest health, based on remote sensing.
Methodology
- The current solution version is based on satellite images from Sentinel-2. Other satellites can be used, if required.
- EOSDA uses vegetation indices for the assessment of plants' health status and its changes (current imagery or time series of images and clustering by indices deviation values).
- Different monitoring frequencies may be considered depending on the type of satellite data and the needs.
Inputs required
- Area of interest (AOI) in .kml or .shp format.
Expected output
- Raster or vector layers with calculated indices or deviation indicating forest health changes (ha/acre, %).
- Analytical report.
Tree species classification
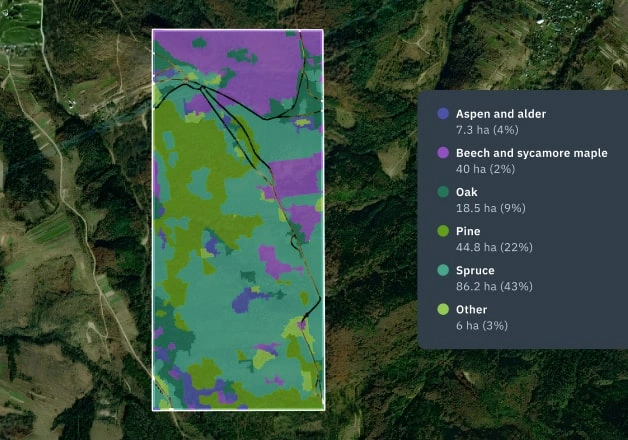
Tree species classification is a solution that allows the detection of different tree species in large areas of forest to optimize forest inventory management.
Methodology
EOSDA utilizes a multi-level Conv-LSTM architecture for crop detection. The model combines spatial (CNN) and temporal (LSTM) analysis. The current solution version is based on satellite images from Sentinel-2.
Inputs required
- Area of interest (AOI) in .kml or .shp format.
- Ground truth data (examples of polygons with the different tree species).
Expected output
- Raster or vector layers with the marked detected classes (species) and additional attribute data (examples).
- Analytical report.
EURD-related analysis
EUDR-related analysis is a solution developed to support companies in preparing their product for compliance with EUDR requirements (confirmation of no deforestation or forest degradation after 2020).
Methodology
EOSDA uses data from Sentinel-1/2, Landsat, or other satellites (including the EOS SAT-1 satellite). Detection is carried out based on the RGD analysis and the spectral characteristics of the forest (by vegetation indices).
Inputs required
- Area of interest (AOI) in .kml or .shp format.
Expected output
- Raster or vector layers with the marked fields and forest/deforestation.
- Raw satellite imagery used for analysis.
- Analytical report, part of EUDR compliance report (examples).
Benefits Of The Forest Solutions By EOSDA
Short-Term Operational Gains
- Rapid response to forest fires
- Fast verification of legal compliance
- Efficient timber harvest planning
- Quick detection of illegal logging
- Timely forest health alerts
Long-Term Resilience And Planning
- Support for sustainable forest management
- Long-term forest cover monitoring
- Contribution to climate change mitigation
- Enhanced biodiversity preservation
- Building a transparent environmental record