Deforestation monitoring through satellite imagery and data analytics

Act before it’s too late. Monitor forest cover loss caused by both natural disasters and unauthorized human activities using EOSDA LandViewer’s satellite imagery and analytical tools to:

  • detect illegal logging and forest clearing as they happen
  • track legal tree cutting and verify its compliance with EUDR
  • access satellite-based insights in just a few clicks
satellite monitoring of deforestation

Satellite-driven solutions for deforestation tracking

Detect and address illegal logging

EOSDA LandViewer allows users to detect deforestation from satellite images, offering a clear view of how landscapes change and enabling faster action against illegal logging.

illegal loggind detected in Congo Basin

Reveal illegal activities in rainforests

EOSDA LandViewer offers access to high-resolution satellite data and vegetation indices to support illegal deforestation monitoring in rainforest regions. By detecting early signs of logging, land clearing, or road construction, users can plan timely intervention to protect vulnerable ecosystems.

NDVI map of a rainforest in Papua New Guinea

Monitor authorized deforestation

EOSDA LandViewer offers reliable tools for tracking forest loss, allowing stakeholders to monitor approved clearing and ensure activities remain within legal and ecological limits.

satellite monitoring of deforestation in Paraguay

Ensure alignment with deforestation-free regulations

EOSDA LandViewer supports supply chain transparency by allowing users to monitor deforestation using remote sensing across sourcing areas. Businesses can verify compliance with deforestation-free commitments, including the EUDR, meet environmental standards, and provide trusted satellite-based proof to stakeholders.

deforestation detected in Ontario, Canada

How to use satellite images for deforestation monitoring

Set your AOI (area of interest)

Choose your area of interest by searching it, drawing it on the map, or uploading a file, so that all analysis reflects conditions in that specific forest region.

Search and select the relevant scene

Narrow down your search by applying filters like acquisition date, cloud cover, sensor type, and AOI coverage. Select imagery that aligns with your timeline for detecting deforestation from satellite images, identifying illegal logging, or assessing recovery after disturbance.

Apply indices or band combinations

Improve your analysis by applying vegetation indices or custom band combinations designed specifically for forest monitoring. Use NDVI, the Deforestation Index, and others to identify early signs of deforestation, illegal clearing, or wildfire damage, and to evaluate the overall health of the forest within your AOI.

Run advanced analytics for forest loss detection

Use tools like Time Series Analysis, Change Detection, and Clustering to track deforestation trends, uncover illegal logging, reveal changes in forest cover, and provide reliable, data-driven insights to support long-term forest conservation through monitoring deforestation using remote sensing.

Setting the AOI on a map searching for the most relevant scene selecting an index to apply to AOI analysing deforestation with dofferent tools

Key alanytical features for tracking deforestation

Indices and band combinations

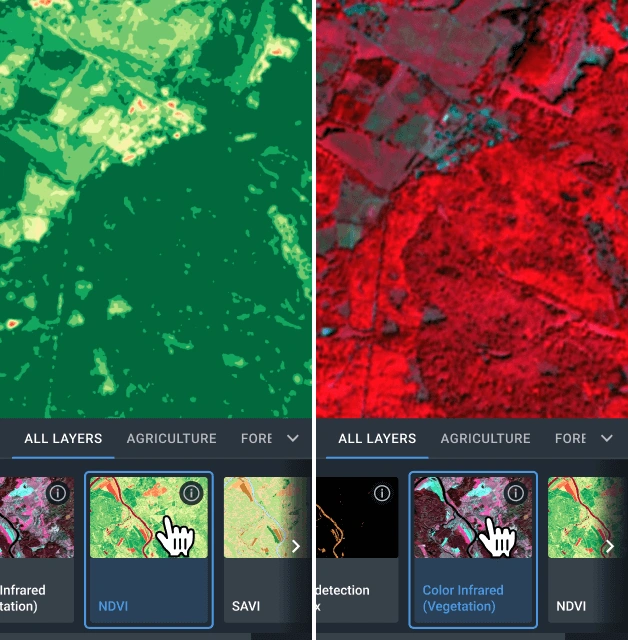
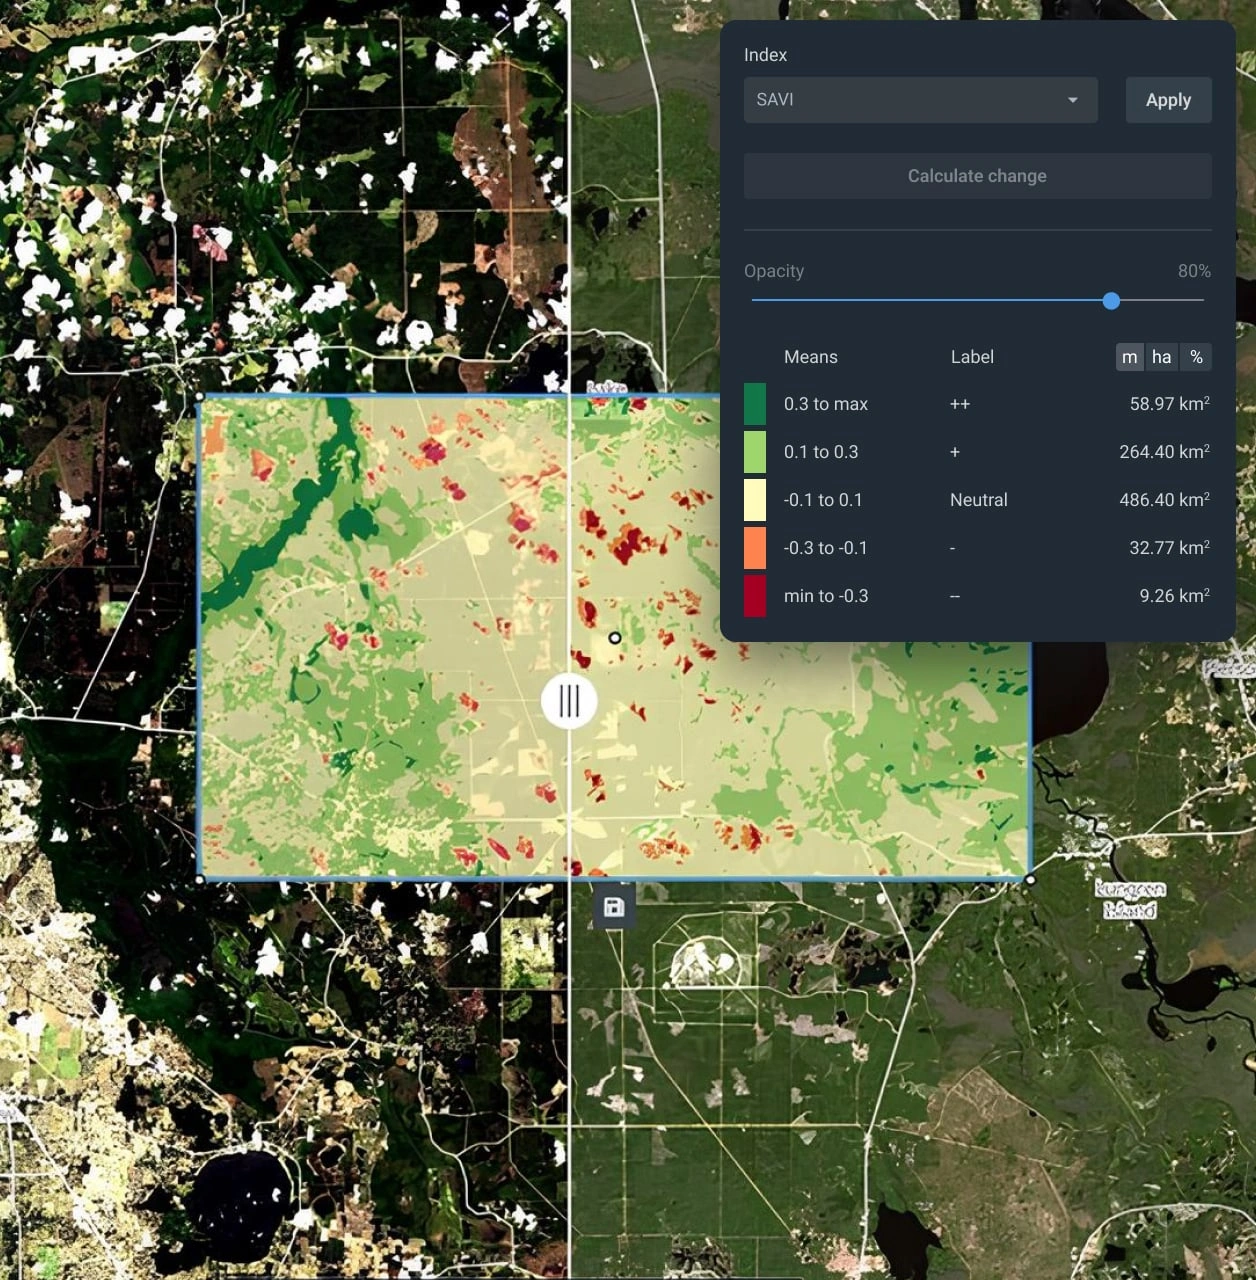
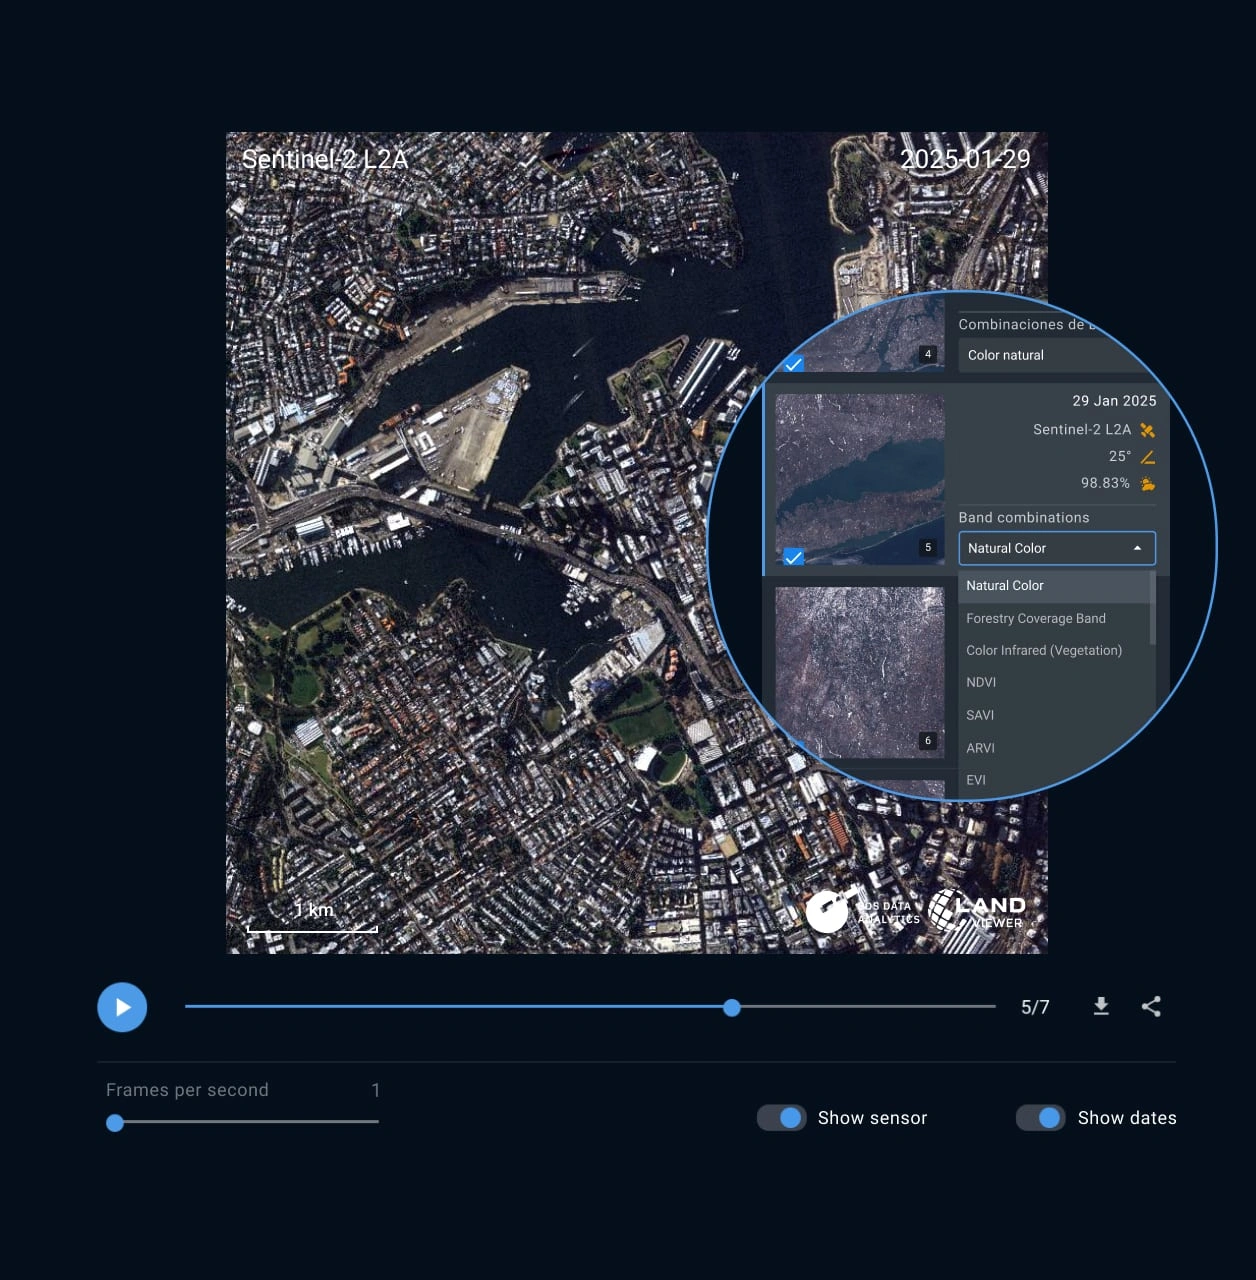
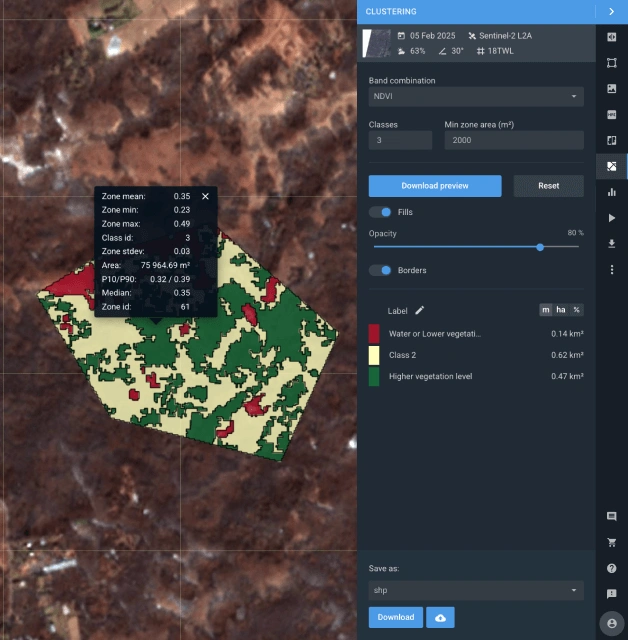
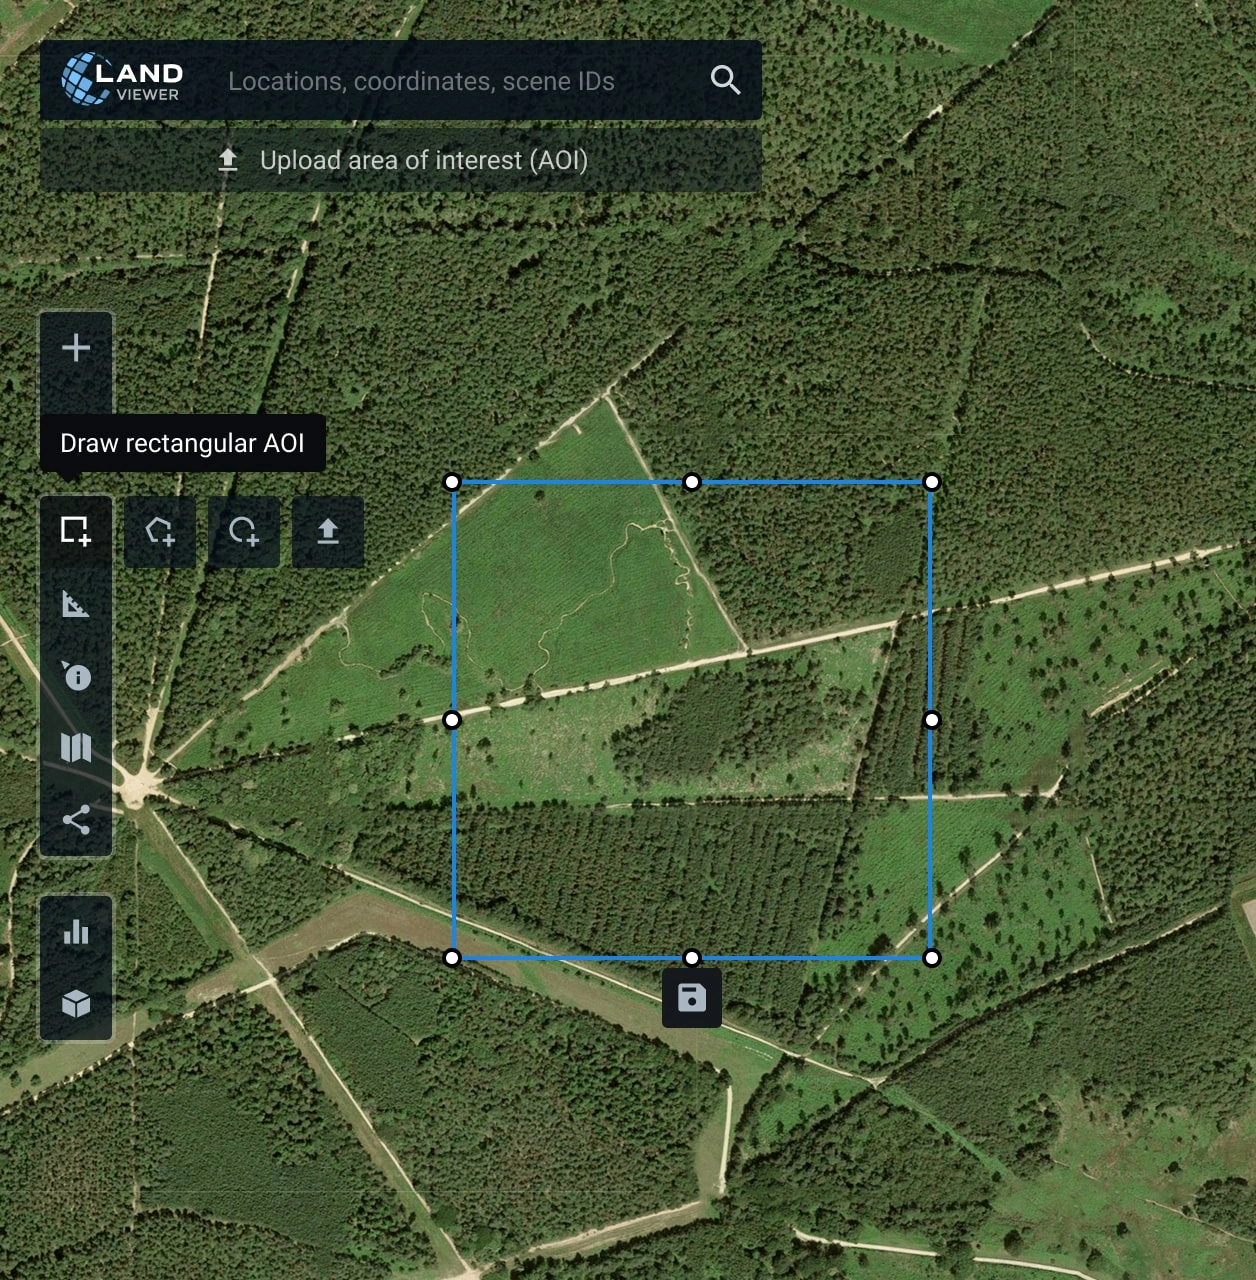
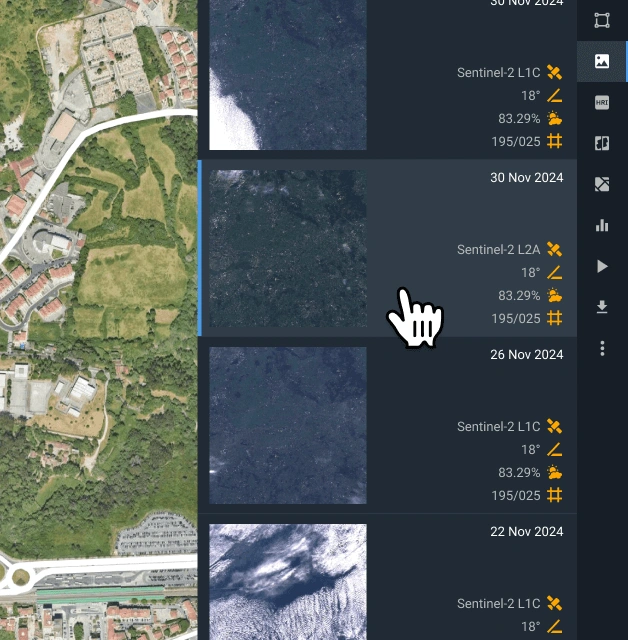
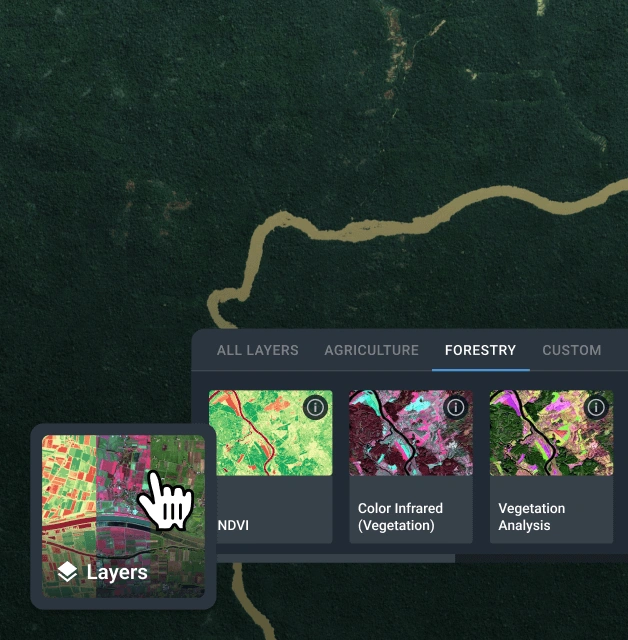
Apply vegetation indices and custom band combinations for deforestation satellite imagery analysis to detect forest loss, monitor degradation, and assess ecosystem health. Among the indices EOSDA LandViewer offers are:

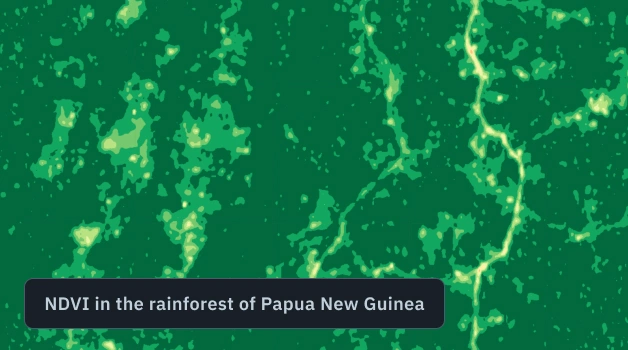
  • NDVI: Detects complete deforestation. No vegetation means tree removal to the root
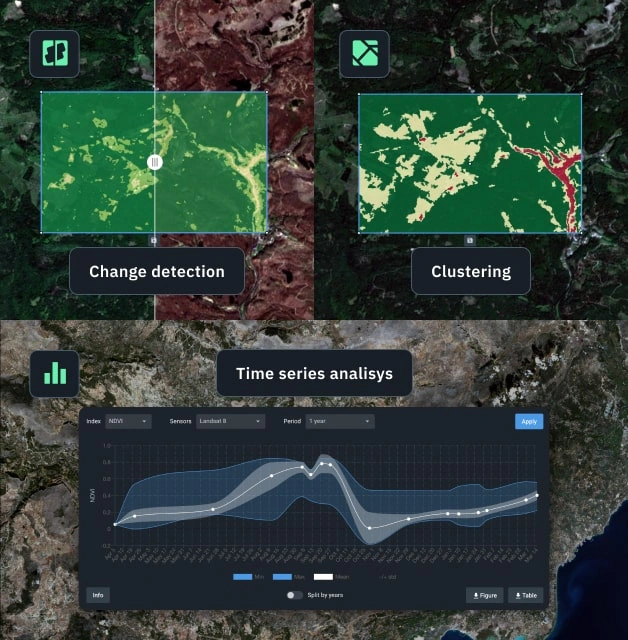
  • Deforestation Index: Compares latest cloud-free images to highlight recent clearing
  • EVI: Reduces atmospheric/soil noise. Good for tropical, cloud-heavy forest monitoring
  • NDWI: Detects clearing in moist forests by tracking water content
  • NBR: Identifies clear-cutting, logging scars, and fire-impacted areas
  • NDMI: Signals forest clearing or drying before logging or fires
application of indices and band combinations

Change Detection

Use Change Detection in EOSDA LandViewer to track forest loss by comparing satellite images over time. Instantly spot illegal logging, land clearing, or wildfire damage within your AOI. The tool highlights vegetation loss and structural changes, enabling fast response and evidence-based action.

applying change detection to deforestation satellite images

Time Series Analysis

Monitor forest change over time with Time Series Analysis to detect gradual loss, seasonal clearing, or long-term degradation. By analyzing vegetation trends with indices like NDVI or NBR, forestry teams can spot early signs of illegal activity, track regrowth, and support proactive mitigation efforts and policy compliance.

Time Series Analysis applied to satellite imagery

Clusterization

Clusterization feature makes monitoring deforestation using remote sensing more precise by grouping forest areas with similar vegetation, health, or disturbance levels. It helps spot degradation patterns and changes in forest structure, guiding smarter decisions and more targeted conservation efforts.

clesterization applied for forest loss monitoring