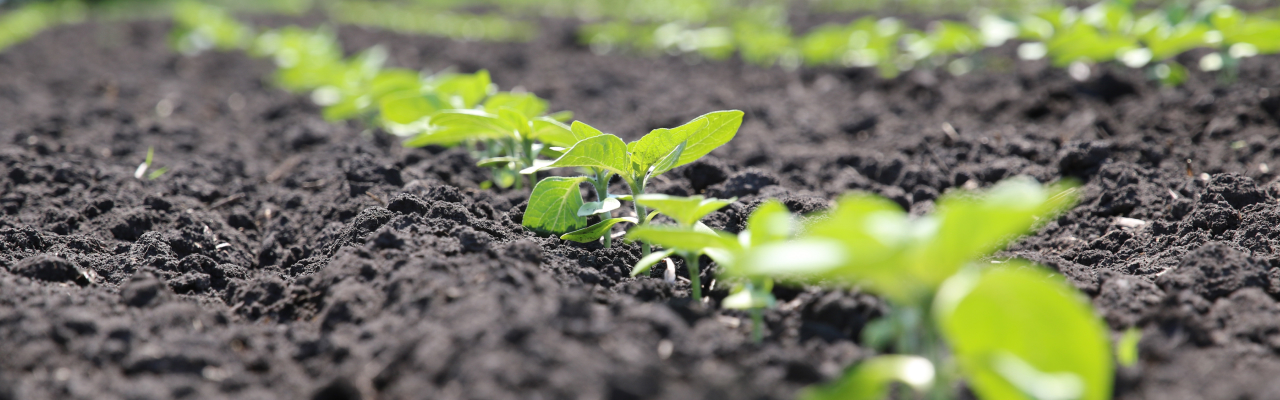
Stages Of Plant Growth And Their Role In Agriculture
Because of the strong impact of plant growth stages on agricultural productivity, their shifts can have enormous financial consequences for farmers. As a result, it is essential to keep an eye on stages of plant growth and make timely adjustments to ensure the crop matures on schedule and remains healthy. Temperature and precipitation, in particular, play a significant role in dictating the schedules of plant growth stages. Monitoring stages of plant growth can also alert farmers to potential problems with the surrounding environment, which can help them make more informed decisions about how to manage their fields.
Different Stages Of Plant Growth
The phenomena that occur at all stages of plant growth and development, from seed germination through plant collapse, are known as phenological events and are studied by phenology. Due to the long history of the topic, the diversity of scientific methodologies, and the wide range of possible applications, there is no one agreed-upon way to identify the various stages of plant growth. Some approaches are straightforward and broad in scope, while others are comprehensive and specific. However, at this time, the BBCH method is widely employed in smart farming and recommended by the vast majority of scientists working to establish a link between phenology and industrial agriculture .
- germination;
- leaf development;
- formation of side shoots;
- stem elongation;
- vegetative plant parts;
- inflorescence emergence;
- flowering;
- fruit development;
- ripening;
- senescence.
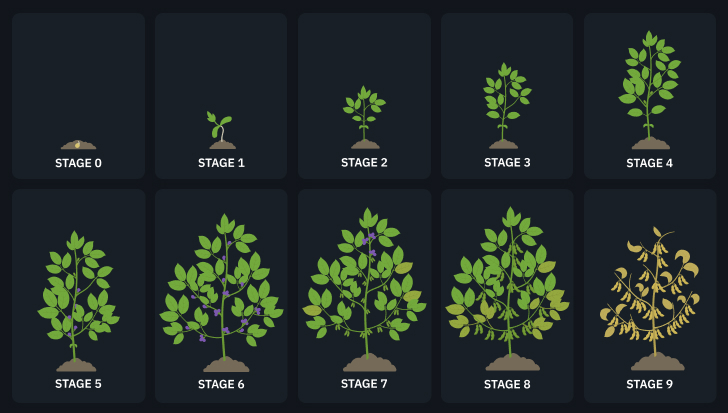
Since the duration of the growth stages of a plant and the phenological events within each vary significantly between species, scientists build comprehensive scales for each species individually. The standard BBCH scale is used for any species that lacks a dedicated scale or serves as a framework within which individual scales can be developed. Let’s take a close look at the ten basic stages of plant growth by the BBCH scale and what they imply for farmers.
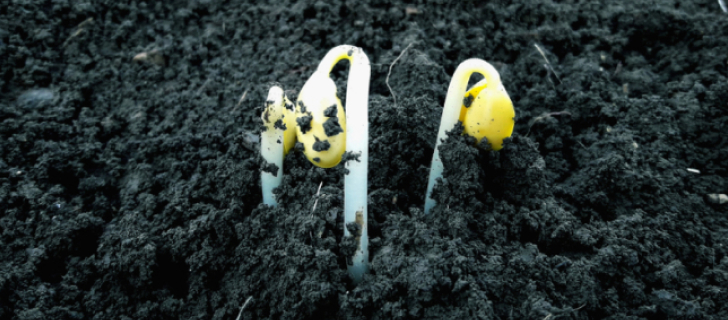
Stage 0: Germination, Sprouting, Or Bud Development
Despite their distinct biological processes, germination, sprouting, and bud development were all lumped under the same primary plant growth stage. Depending on the type of crop, growth phase 0 can last anywhere from a few days to a few weeks. At this point in the plant’s development, the seed has sprouted and produced what are called “seed leaves,” which are easily distinguished from the mature leaves.
Primarily, the germination and budding stage of plant growth requires the right temperature and oxygen levels. Additionally, it depletes the nutritional reserves of plants, potentially leading to nutrient deficiency without additional fertilization. A state of dormancy is often needed beforehand.
At growth phase 0, the crop constantly requires water to kickstart a healthy metabolism. In some cases, watering is also necessary for removing a germination inhibitor from the seed (especially for desert annuals) .
At different stages of growth, plants are vulnerable to different pests. In contrast to wireworms, which eat seeds before or just after they germinate , earwigs tend to feed on young shoots, foliage, and flowers.
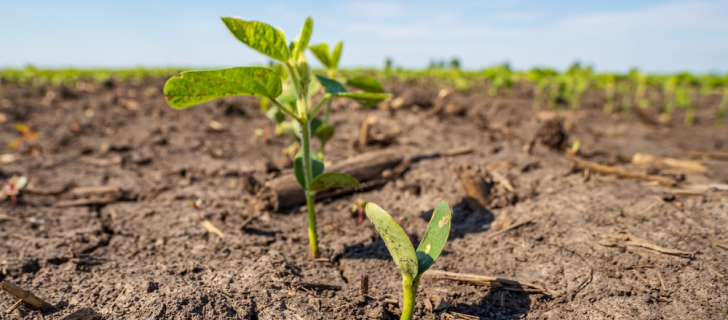
Stage 1: Leaf Development
The leaf’s photosynthetic power is the foundation upon which the entire plant builds. Thus, stage 1 of plant growth is essential for the crop’s normal development. All the plant nutrients by this stage of growth will help it through the next phases of its development. Thus, fertilization is essential.
At growth stage 1, the plant produces “genuine” leaves, which are miniature copies of the fully developed leaves. Leaf development is guided by a universal fundamental program, varying a little to suit the needs of individual species and environmental conditions. Leaves develop into flat structures of varying sizes and shapes, beginning on the shoot’s apical meristems . Hormones in plants, as well as transcriptional regulators and mechanical qualities of the tissue, all play a role in controlling this process.
Stage 2: Side Shoots Formation Or Tillering
Tillering is the plant growth stage during which new aerial shoots form. Rather than spreading out like rhizomes and stolons, tillers grow vertically. The outcome is a considerable rise in the number of new shoots occurring immediately adjacent to the initial shoot. “Daughter plants” occasionally refer to the new shoots that develop from the “parent plant.”
Tillering can also mean the development of side shoots. Each new shoot comprises a central growth point, which eventually develops into a jointed stem defined by nodes and internodes similar to a bamboo pole.
Stage 3: Stem Elongation Or Rosette Growth And Shoot Development
Some parts of the plant, like stems and roots, keep growing throughout the plant’s life: this process is called indeterminate growth. New cells are produced at the tips of growing shoots. Growth in stems occurs at many different sites, unlike just a few in the root system. The duration and intensity of these changes vary between species, but individual crops within a single species tend to comply with some norms. Global warming significantly impacts the plant at growth stage 3 of its growth due to the direct correlation between temperature and stem elongation.
Stage 4: Development Of Vegetative Plant Parts Or Booting
The development of strong stems and plenty of green leaves characterizes the vegetative stage of plant growth. These processes are critical because photosynthesis relies on sufficient leaf surface area to absorb light. Notably, healthy leaf development usually follows strong root growth.
Nitrogen fertilizers will be especially beneficial at this stage of plant growth, encouraging vigorous stem and leaf growth during the vegetative stage. Also, for grass, at the late vegetative growth stage, farmers may already apply pasture management strategies like grazing once a plant has developed sufficient leaves for photosynthesis and roots for anchoring, storage, and mineral intake.
Stage 5: Inflorescence Emergence Or Heading
Inflorescence emergence is the process by which a cluster of flowers is arranged along a floral axis. Heading refers to the process by which a seed head emerges from the sheath formed by the flag leaf. The fact that this is the start of the reproductive growth phases is the unifying factor that groups these two different biological processes into one phase of plant development.
At growth stage 5, a plant’s primary focus shifts from vegetative expansion to developing reproductive structures such as flowers and then fruits. Phosphorus, which can be supplied via fertilizers, is especially critical at this point in the plant’s development.
Plants’ susceptibility to disease decreases as they mature. This may indicate that crops that are already resistant to a disease will become even better at controlling infection over time.
Stage 6: Flowering
During growth stage 6, flowering plants create the reproductive structures necessary for sexual reproduction. Annuals only live for one year, and their flowering and subsequent demise coincide. In biennials, the first year is spent in the vegetative phase, and the second is devoted to flowering and dying. Most perennials will continue to bloom every year if the conditions allow. Potassium is a vital nutrient for plants during this phase of development, aiding flowering and fruiting and improving overall crop health. Also, flowering is among the critical stages of crop growth for irrigation.
The advent of gibberellin, a plant hormone, a specific temperature, and the length of day and night (photoperiod) are the most common triggers for flowering in many plants. Without a period of wintertime cold, the flowering time of many annual plants (such as winter wheat) and biennial plants is delayed. Vernalization describes the transformation that results from this extended period of frigid temperatures.
EOSDA Crop Monitoring
Performing fields analytics based on relevant satellite data to ensure effective decision-making!
Stage 7: Development Of Fruit
There has been a lot of focus in plant biology and horticulture on the plant growth stage when fruits are developing. In most flowering plants, fruit development occurs in the ovary after fertilization. A mature ovary is called a “fruit” because of its edible qualities. The fruit is a safe haven for the growing embryo and its seeds since it encloses them.
Fleshy fruit development is generally broken down into four phases :
- In the first phase, known as floral development, the identity, number, and shape of floral organs are established.
- With fertilization comes the onset of the second phase, cell division.
- In the third phase, cells undergo fast expansion and endoreduplication until ripening begins.
- The fruit’s flavor, texture, nutritional components, and appearance are determined during the ripening stage, the fourth phase that begins after fruit growth stops.
At this point, plants can continue to develop without the need for nitrogen. Now is the time to provide your plants with phosphate and potassium to promote ripening and increase crop yield.
Stage 8: Ripening And Maturity Of Fruit And Seed
At the ripening stage of plant growth, fruits typically respond to a ripening signal: a surge in ethylene production. Infection with bacteria or fungi, as well as harvesting the fruit, can stimulate the synthesis of ethylene, signaling the ripening process. As soon as the fruit gets this ethylene signal, it goes through a series of changes that lead to it ripening.
To put it another way, new enzymes are manufactured. Enzymes such as amylase and pectinase aid in the digestion of starch and pectin, respectively, and hydrolases assist in breaking down compounds within the fruits. The genes responsible for the transcription and translation of these enzymes are turned on by ethylene. Enzymes catalyze reactions that modify the fruit’s properties: color, texture, flavor, and scent.
Stage 9: Senescence And Beginning Of Dormancy
There are telltale signs of senescence: degenerative alterations in the cells, commonly linked to an increase in waste products and a change in metabolism. Plant senescence is regulated by many environmental factors, the most prominent of which are photoperiod and temperature. However, some hormonal treatments may slow down the senescence stage of annual plant growth.
The onset of winter dormancy is signaled by leaf drop in perennial plants. Towards the end of the growing season, shorter days and cooler temperatures trigger leaf senescence in many trees. The green chlorophyll disappears, and the yellow and orange carotenoid pigments become more noticeable. The length of the day may govern leaf senescence in deciduous trees through its effect on hormone metabolism.
With just a brief overview of all ten stages of plant growth by BBCH, this scale may seem overkill to some farmers who already have their hands full managing all the other aspects of a successful agribusiness. However, the introduction of the BBCH scale is due to our increased understanding of crop production and the recognition that the outcomes of farm management are highly dependent on the crop growth phase during which they are applied.
How To Track Plant Growth Stages With EOSDA Crop Monitoring
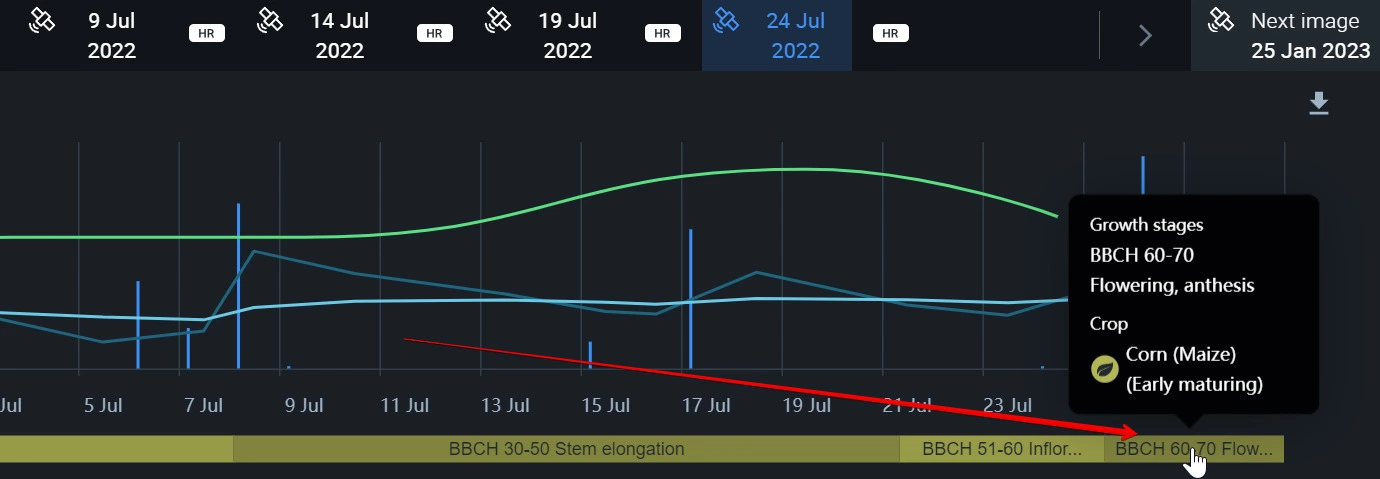
Typically, growers clearly understand what farm management activities need to be done at what stages of plant growth. Yet, for large farmlands, it is difficult, imprecise, and sometimes impossible to determine “by eye” what phase of growth the crop is in and how long this phase will remain.
That’s why we included a Growth Stage feature on the EOSDA Crop Monitoring platform. Its primary purposes are to help farmers:
- understand the current growth stage of the plant;
- check if the crop is underperforming or overperforming;
- determine when it is best to apply fertilizer, irrigate the field, or perform other agricultural tasks to ensure normal crop growth.
The platform’s growth stage scales (based on the BBCH universal scale) now cover more than 30 different crops, allowing for precise monitoring of their development. Corn (maize), oats, potatoes, soybeans, sunflowers, and wheat are just a few examples. Email us at sales@eosda.com, and we’ll set you up with a complete list of available crops.
Track Missed Farm Activity
Each crop has its unique needs at each growth stage, so farmers must adjust fertilizer application, watering, and other practices accordingly. If the agricultural worker does not take the required steps at this stage of crop growth, leading to lower vegetation, the index graphs in EOSDA Crop Monitoring will show a decline.

Know When To Spray Or Water The Field
Using EOSDA Crop Monitoring to get the BBCH growth stages for the specified crop, you can time your fertilizing, precision irrigation, and herbicide sprays for maximum effect. Based on current and predicted weather data, the platform’s AI-driven algorithm accurately estimates different stages of plant growth and how long they will last.
In addition, farmers can use the platform’s 14-day weather forecast in combination with data on the plant growth stage to save time and money while carrying out necessary agricultural activities.
For instance, you schedule the application of pre-emergent herbicides to the corn field for the third day following planting, giving yourself plenty of time between planting and the first sprouts appearing. However, the weather forecast on the platform for that day predicts rainfall, which will wash away those chemicals. In this case, you can wait until the next day to spray the herbicides while still protecting the crop at the right time in its development.
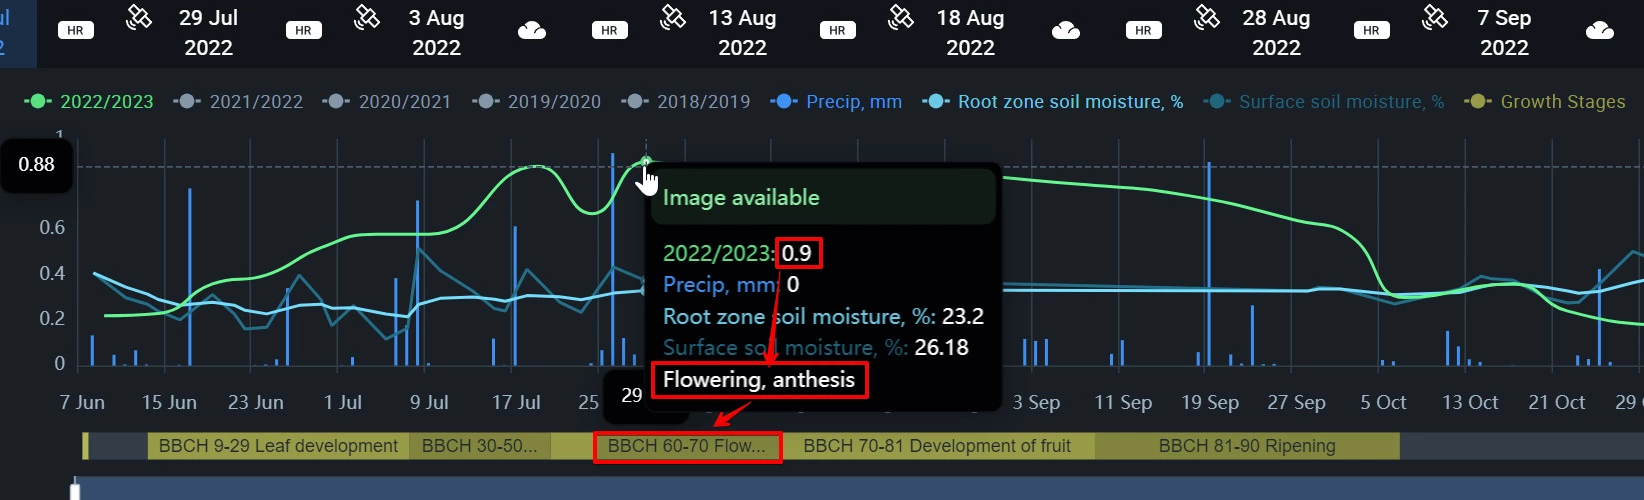
Examine Crop Performance
By combining the plant growth stage scale based on weather data with vegetation indices derived from satellite data, you can get a complete picture of how crops perform in your fields. Suppose your crop isn’t performing as well as it should for its growth stage. In that case, you can check for crop diseases and pests or boost productivity by applying fertilizer, crop protection methods, and any other appropriate field management activities. On the other hand, if the crop is overperforming, you can accelerate the harvest schedule rather than risk damaging the crop by waiting until it is overripe.
Farmers can make better use of input supplies and increase their crop yields with the help of knowledge about the stages of plant growth and the exact correlation between these stages and field management. The standardized language used by the BBCH growth stages scale aids communication between agriculture and related industries. This scale’s global scope will also facilitate the spread of beneficial crop-growing ideas and technology all around the world.
About the author:
Vasyl Cherlinka is a Doctor of Biosciences specializing in pedology (soil science), with 30 years of experience in the field. He attended the engineering college in Ukraine and received his degree in agrochemistry, agronomy and soil science in the Chernivtsi National University. Since 2018, Dr. Cherlinka has been advising EOSDA on problems in soil science, agronomy, and agrochemistry.
Recent articles
Nitrogen Fertilizers: Why And How To Apply Sustainably
Nitrogen fertilizers boost yields and strengthen food security. But their application is a double-edged sword, requiring smart management to reap benefits while minimizing environmental impact.
Yield Estimation & More: New In EOSDA Crop Monitoring
EOSDA Crop Monitoring is constantly developing and answering clients’ demands for precision agriculture features. Discover January-March 2024 updates: Yield estimation, Typical growth index, and more.
Growing Sweet Potatoes: Planting, Care And Harvest
Growing sweet potatoes — quite straightforward — is a great option for first-time and seasoned farmers alike. Here you'll find helpful tips for growing a bumper crop.